Take a moment to answer these questions.

For an object that’s slowing down, like a skateboard or a curling rock:
- What does the graph showing the distance that was travelled over time look like?
- What does the graph showing the speed over time look like?
- What does the graph showing kinetic energy over time look like?
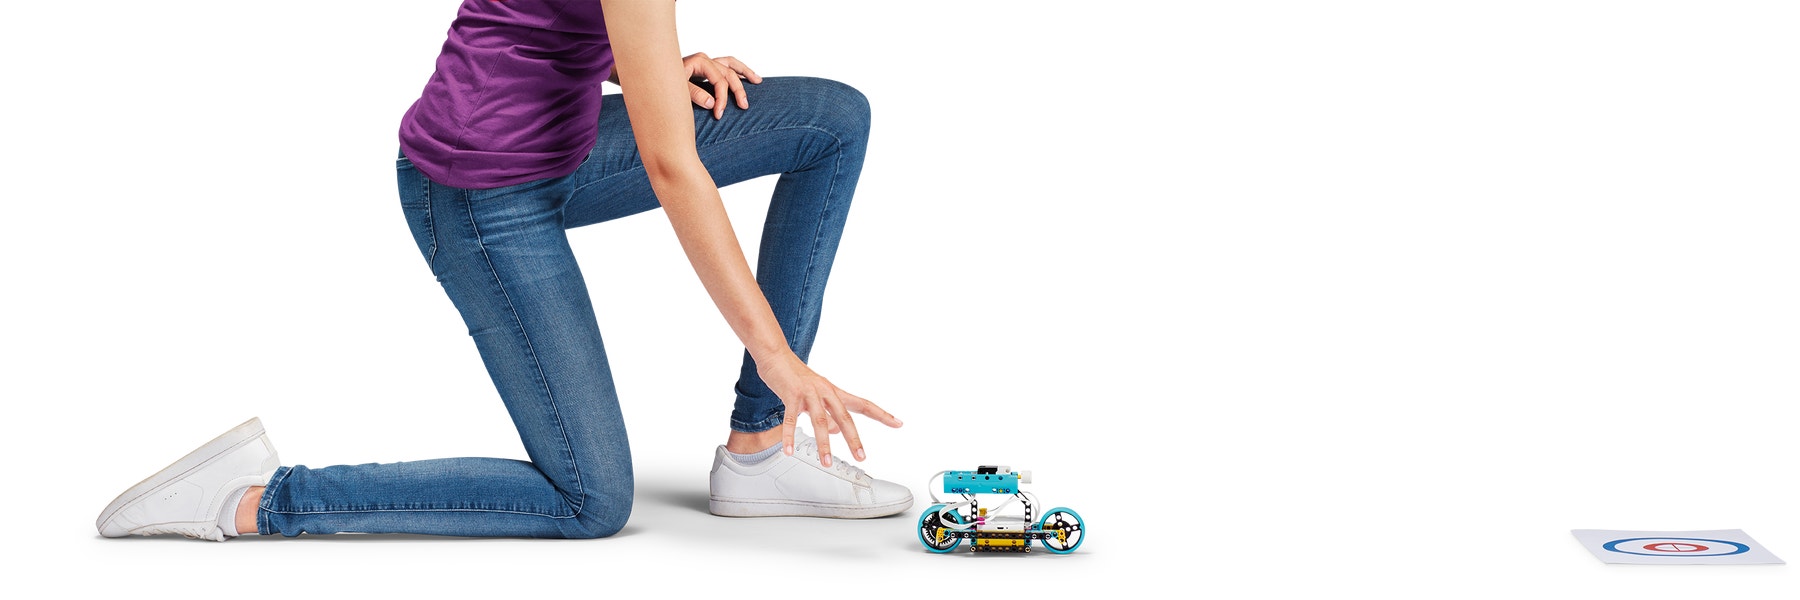
Build a street curling rock!
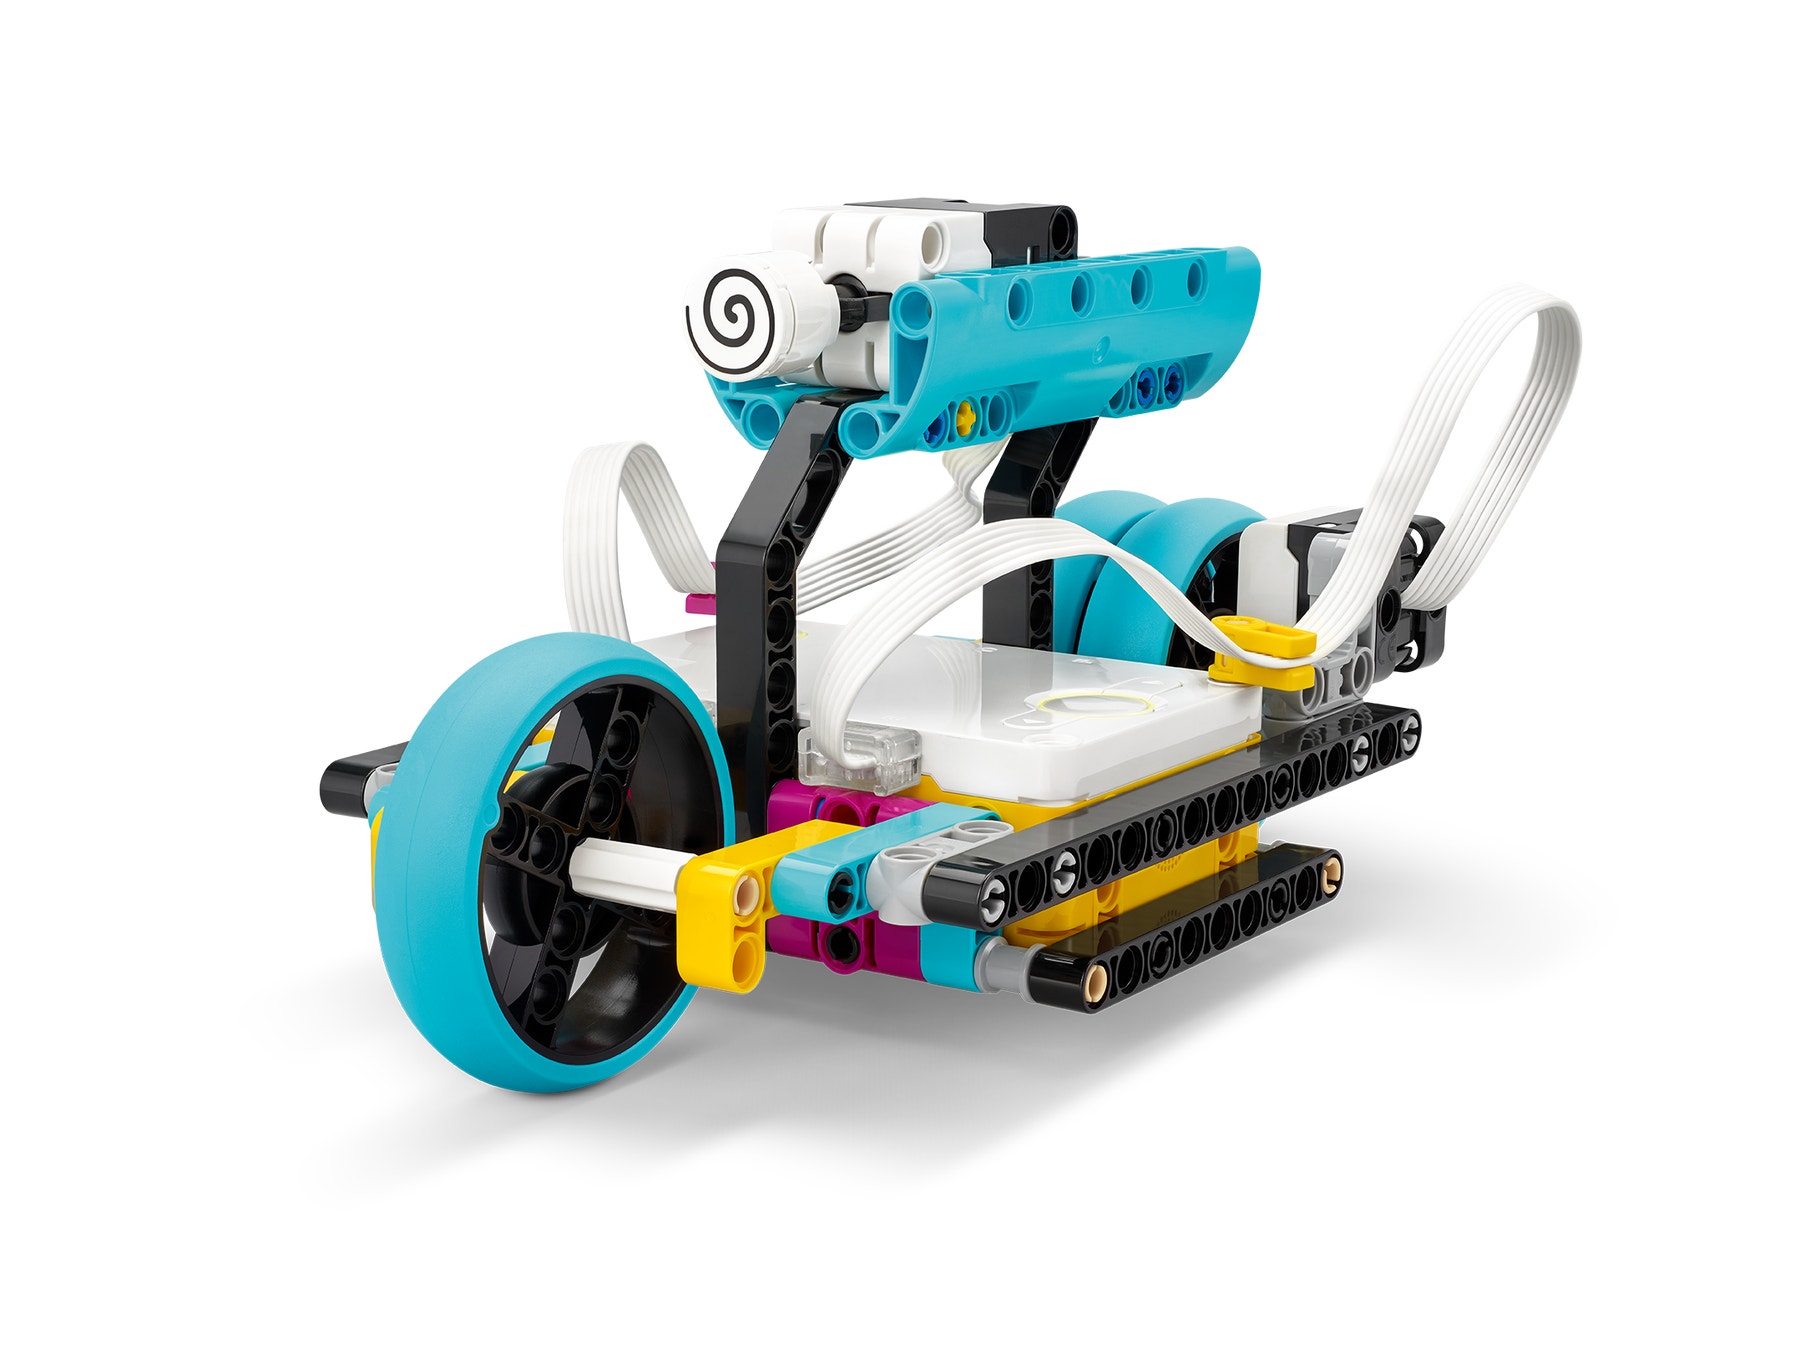
- Done! I've built my model.
Practice your push.
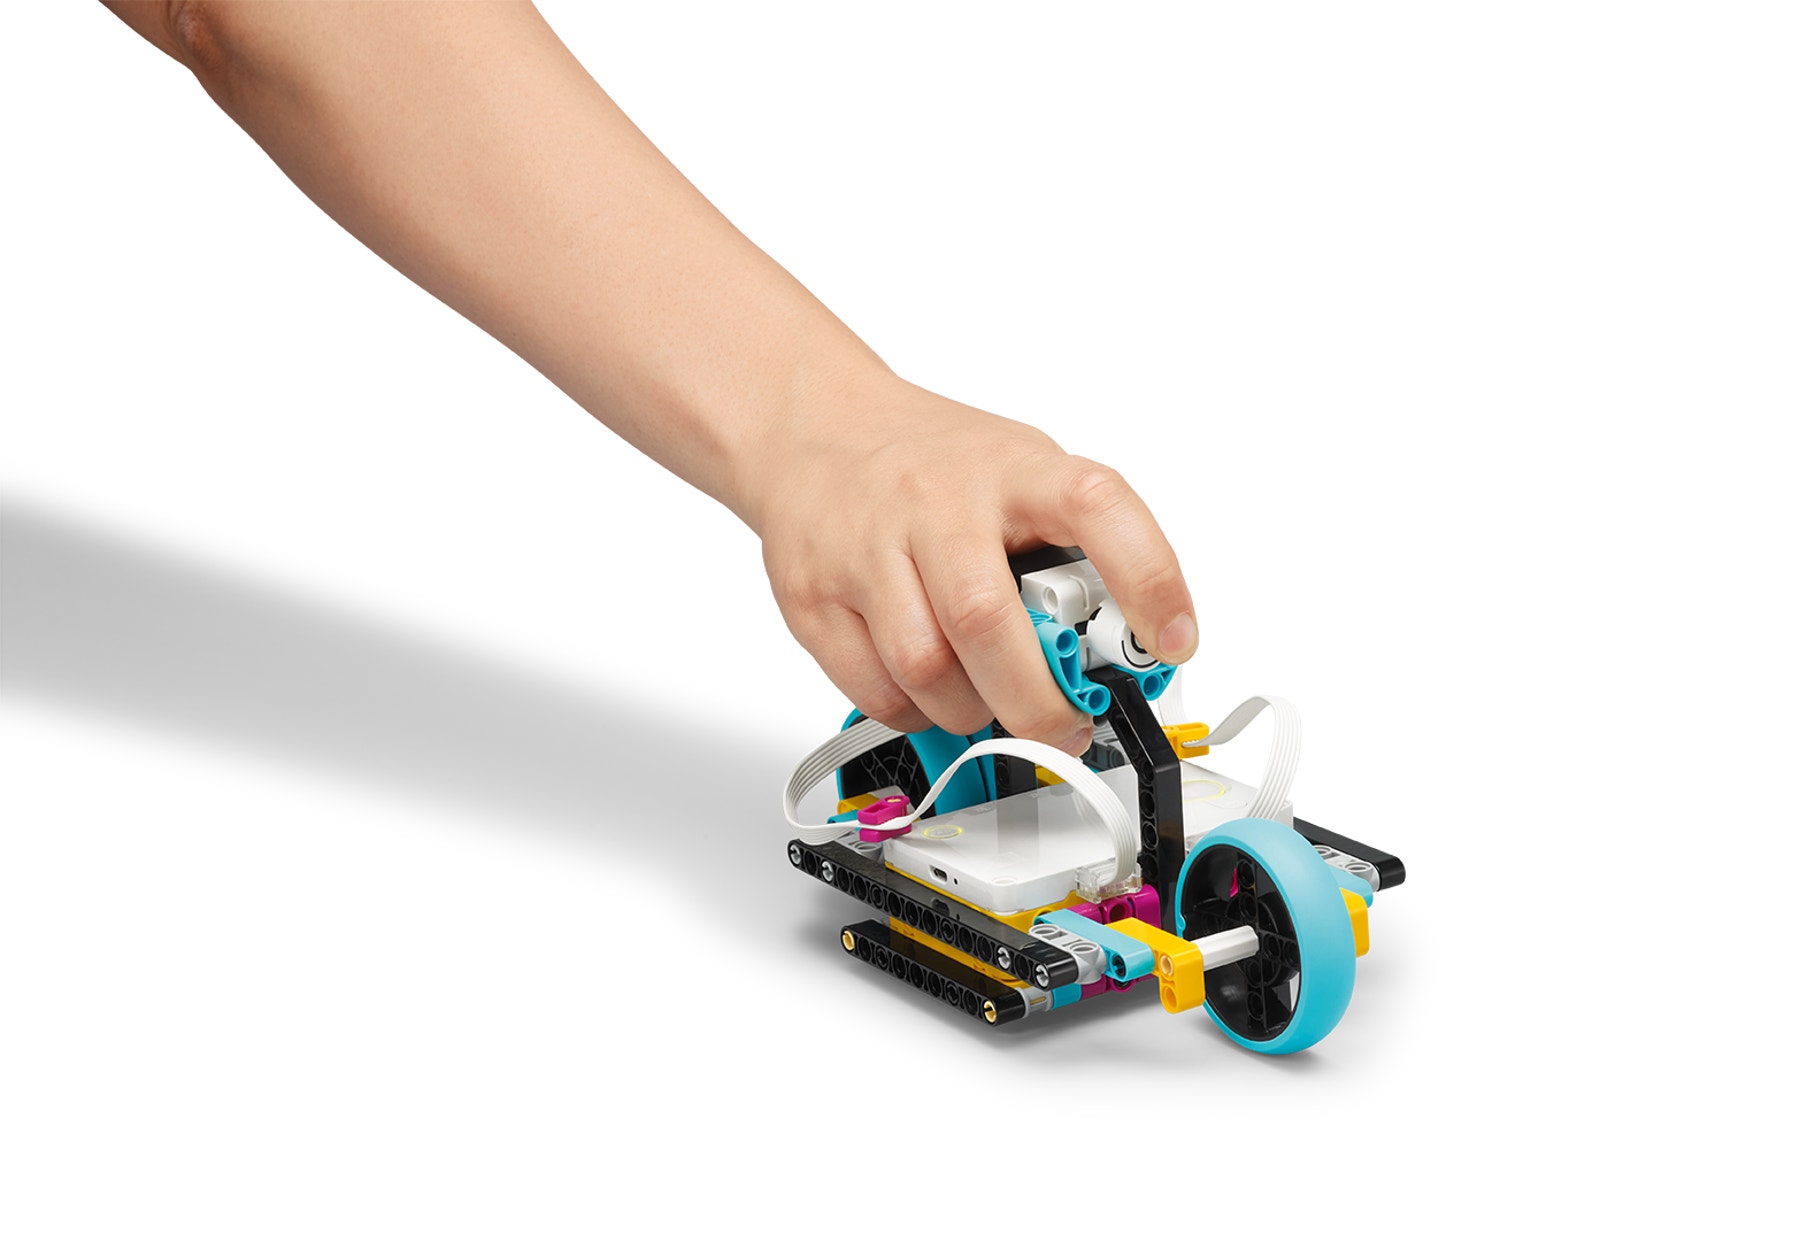
- I have a start line and a target.
- I can push my curling rock towards the target and trace a graph.

Get your initial speed.
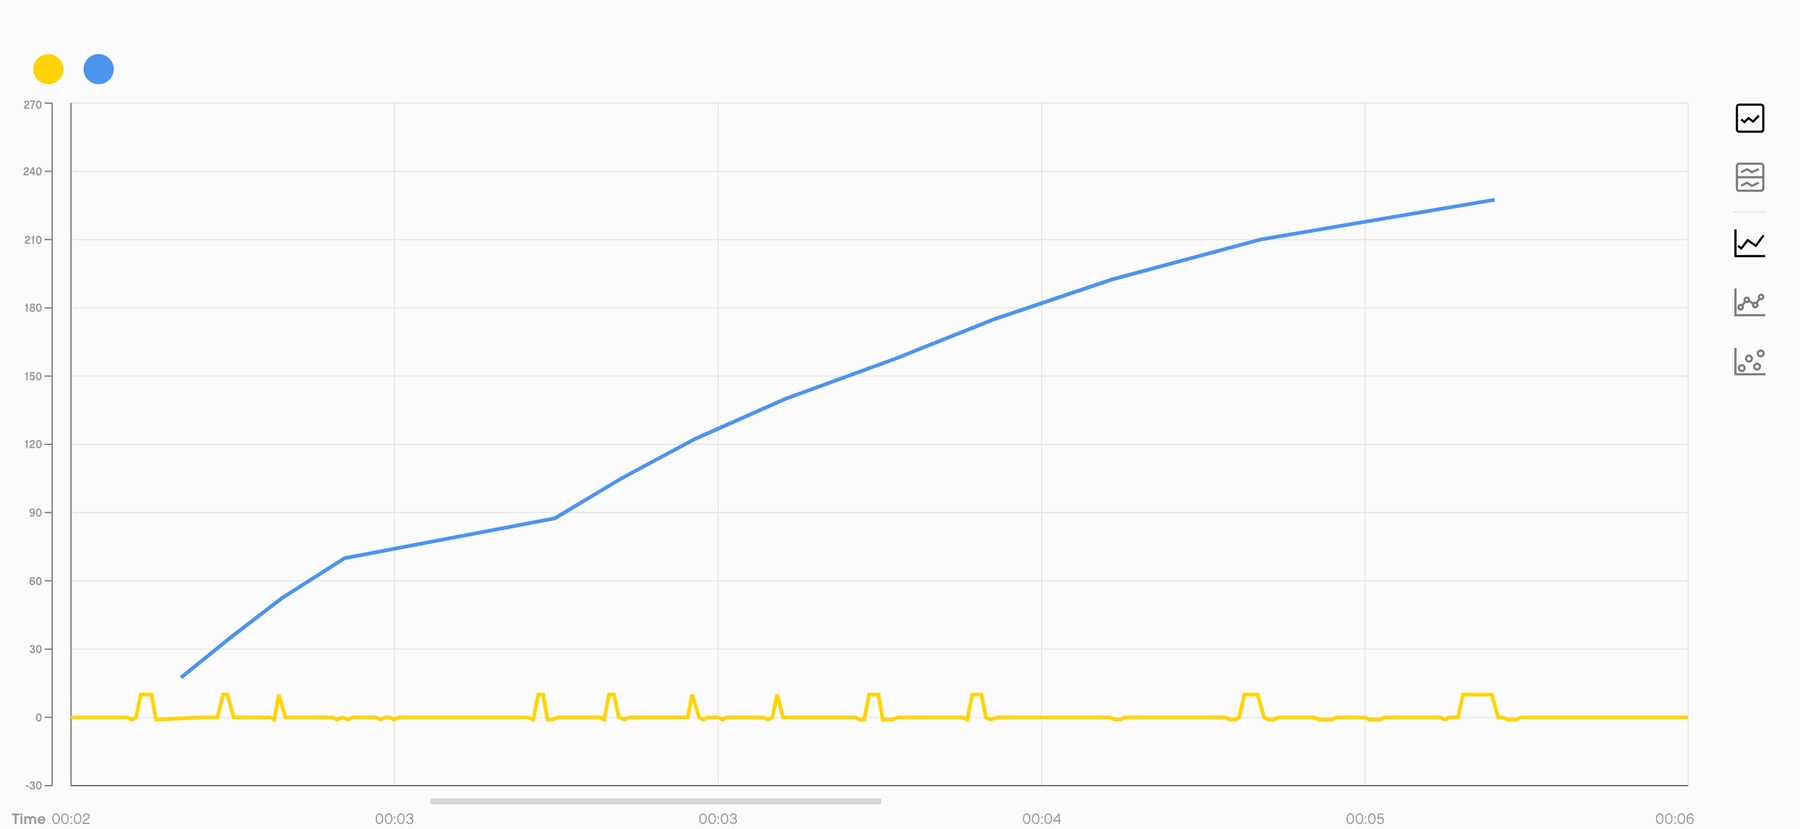
- I've changed my program to get my initial graph speed.
- I've tried a new push of my curling rock, and I can log an approximate initial speed.
Find the initial kinetic energy.
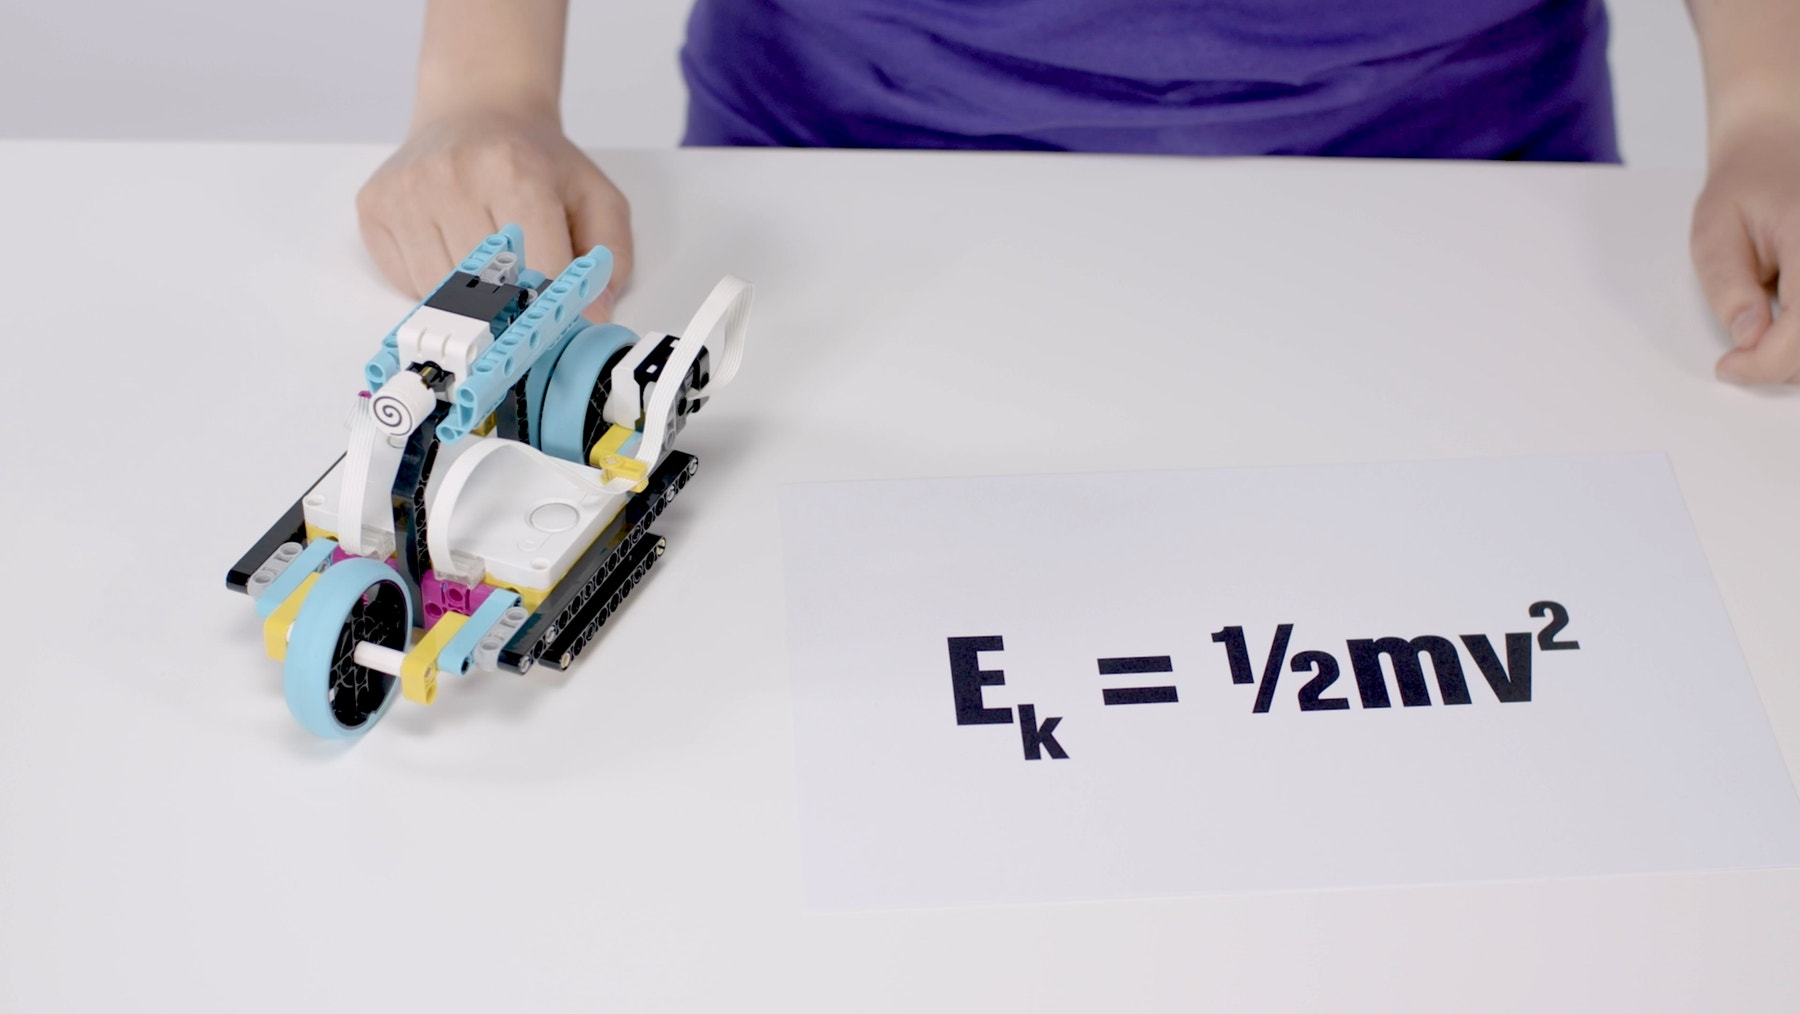
- My program is calculating and showing the kinetic energy at the beginning of my push.
m = 305 g
Let's play a game!
- I've prepared the playing field.
- I've tried to hit the centre of the target 3 times.
- I've measured the distance between the target and where the rock stopped.
How well did you do?
- I can answer these questions:
- How would you summarise your experiment?
- What have you learned?
Brilliant!