This Is Uphill
Graph energy consumption to gain potential energy.
Engage
(Before Class (20 Min.))
- The topic of this lesson is energy transfer. Your students will learn that in order for a biker to maintain a constant speed (i.e., constant kinetic energy) when going up hill (i.e., to gain potential energy), he or she needs to input energy. This lesson uses a model of an electric bike. Its energy will come from an increase in its motor's power consumption. In a real-life situation, this energy would come from extra effort from the bicyclist.
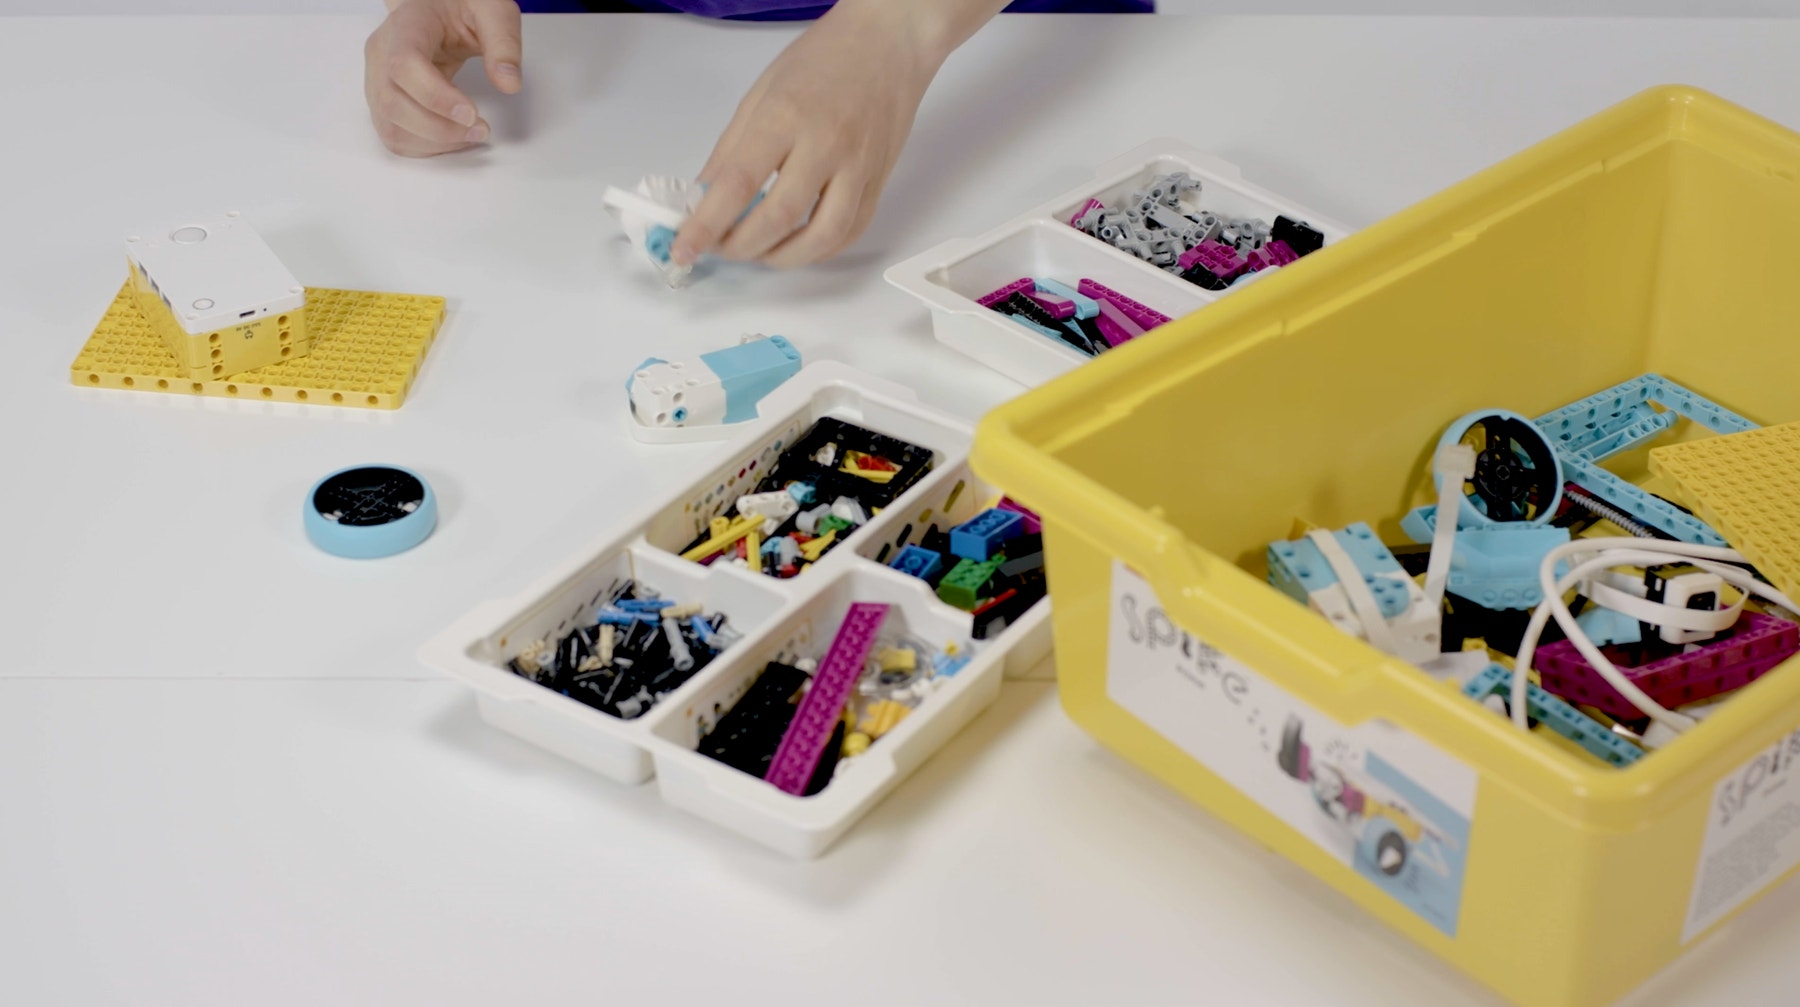
- Use various materials to engage your students on the topic of energy transfer.
Ignite a Discussion
Start a discussion by asking questions related to the lesson. Here are a few suggestions:
- What will happen to your speed when you go up a hill?
- What type of energy do you gain as you go up?
- What do you need to do to maintain a consistent energy level of you on your bike (your system)?
- Why do you think that's the case?
Have your students write down their thoughts as a hypothesis.
Explore
(In Class, 30 Min.)
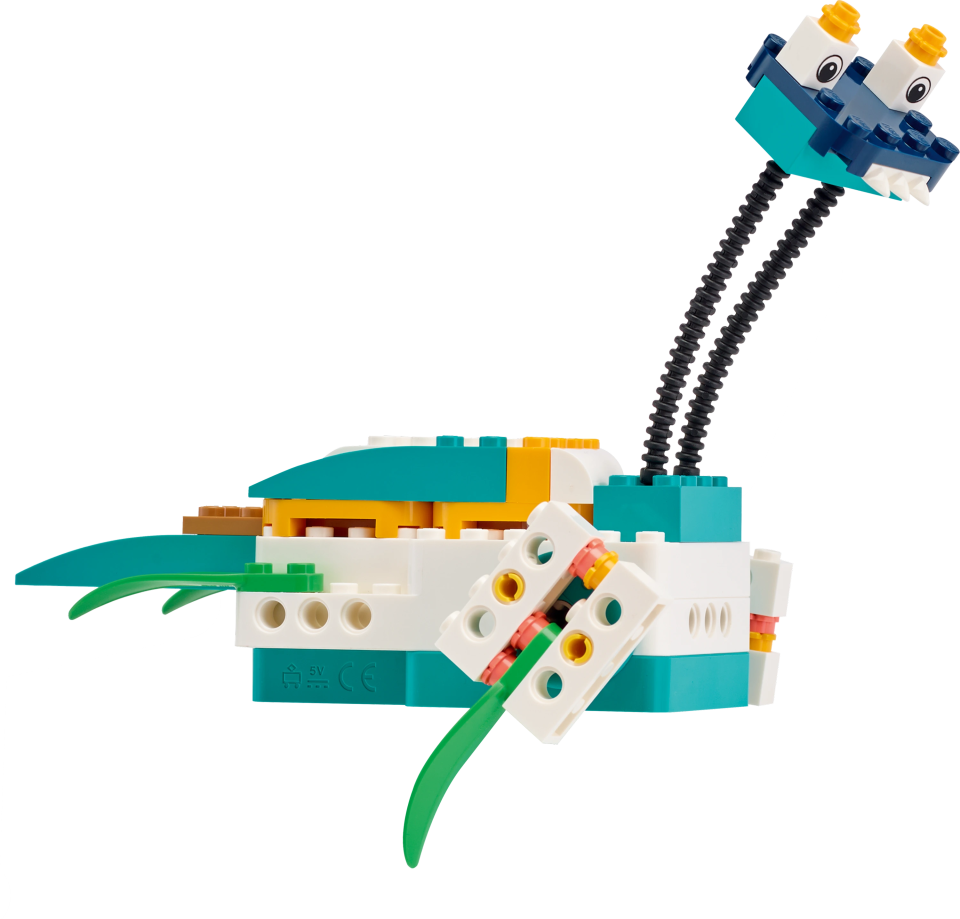
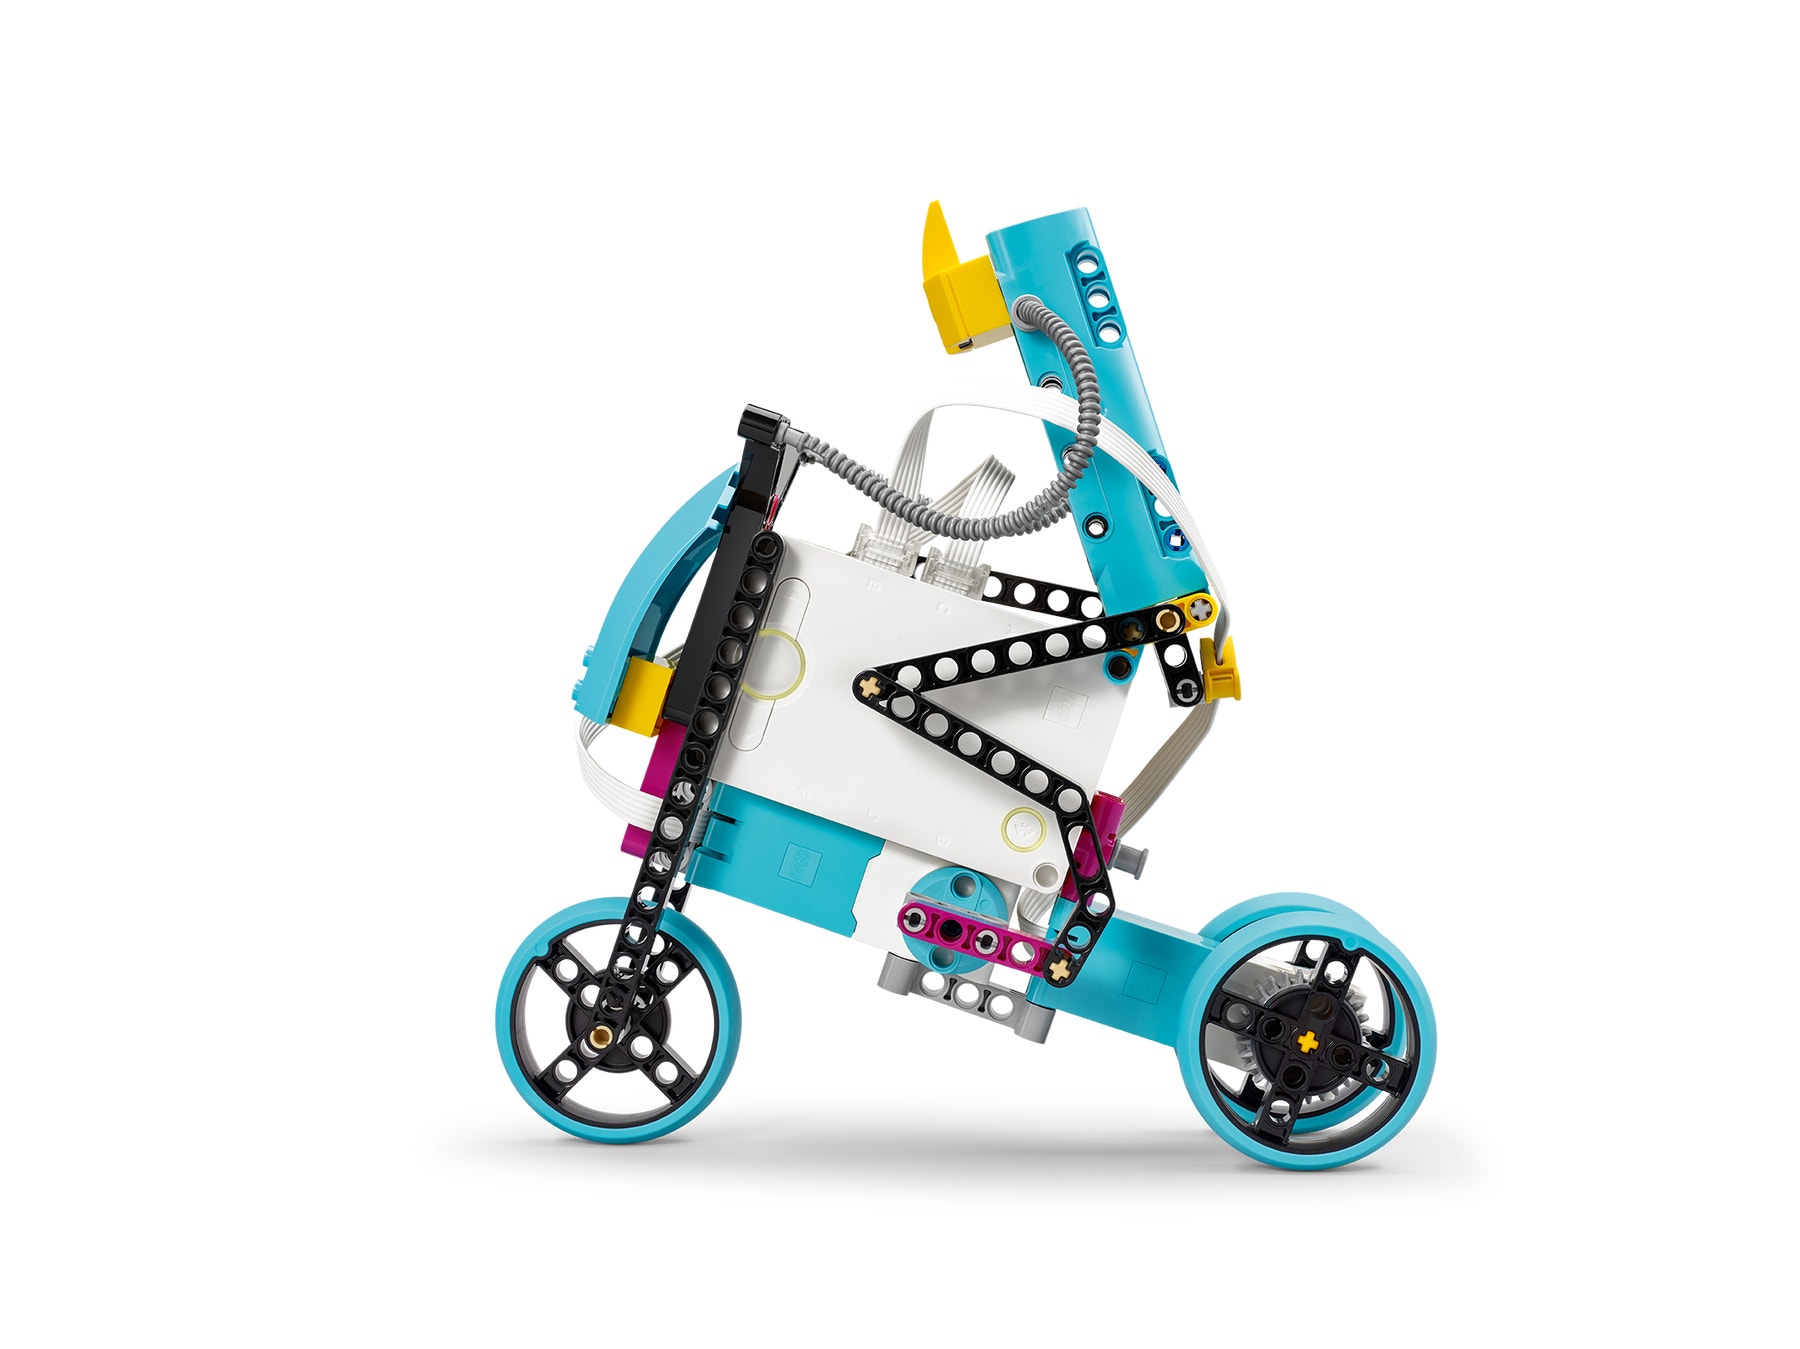
- Have your students build a smart bike that can record its motor's power consumption and the angle of a slope. They can create their own models, or follow the building instructions in the app to build the Smart Bike model.
- Ask your students to try out their models on a flat surface using the suggested program in the SPIKE App.
- Tell them to look at the graph and document what they see:
- Why do the two plotted lines look like they do?
Explain
(In Class, 45 Min.)
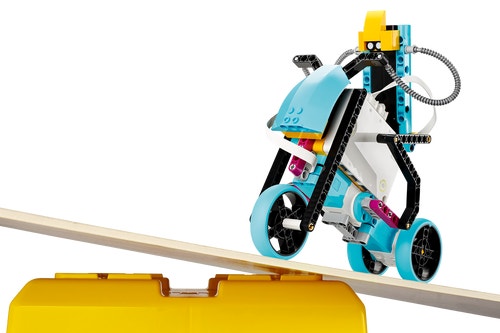
- Have your students repeat the experiment using a slope, which they can create using the SPIKE Prime box and a plank.
- Ask your students to explain how the smart bike's motor is adding energy to maintain a constant speed.
- Have them explain the relationship between the motor's power consumption and the angle of the slope.
- Tell them to export their data as a CSV file, so they can manipulate it in other software if they wish.
Elaborate
(After Class, 25 Min.)
- If your students still have access to their SPIKE Prime Sets, have them complete the tasks from the SPIKE App, to elaborate with hands-on learning, for example:
- Challenge your students to create their own paths. Ask them to create paths that include a flat surface, and upward and downward slopes.
- Have them trace what they think the graph of the motor's power consumption will look like. Then ask them to run their bike along the path to see if they were right.
- If your students don't have access to their sets, have them complete their Student Inventor Notebook, or assign one of the extension activities suggested below. Most of the extension activities can be done using the data collected during the hands-on session
- Facilitate a sharing session in which your students exchange their thoughts and results of this experiment. This can be done using whichever method/tool is most efficient (i.e., in-person or online).
Evaluate
- Give feedback on each student's performance.
- You can use the assessment rubrics provided to simplify the process.
Assessment Opportunities
Teacher Observation Checklist
Establish a scale that meets your needs, for example:
- Partially accomplished
- Fully accomplished
- Overachieved
Use the following success criteria to evaluate your students' progress:
- The students can program a device to log data on a line graph.
- The students can interpret the values coming from the line graph.
- The students can explain the transfer of energy using appropriate terms.
Self-Assessment
Have each student choose the brick that they feel best represents their performance.
- Blue: I can graph data using the program provided in the app.
- Yellow: I can create my own line graph and explain my results.
- Violet: I've created new experiments on my own.
Peer-Assessment
Encourage your students to give feedback to others by:
- Having one student score the performance of another using the colored brick scale above.
- Asking them to present constructive feedback to each other so that they can improve their performance during the next lesson. This is a great opportunity to use videoconferencing tools or blog posting tools in a blended learning scenario.

Differentiation
Simplify this lesson by:
- Taking the time to describe with your students what a direct proportion is.
- Asking your students give examples of a direct proportion from their daily life.
Take this lesson to the next level by:
- Asking your students to build their own smart bikes
- Challenging your students to create their own scientific protocols and decide which value(s) they'll track and how they'll do it
Tips
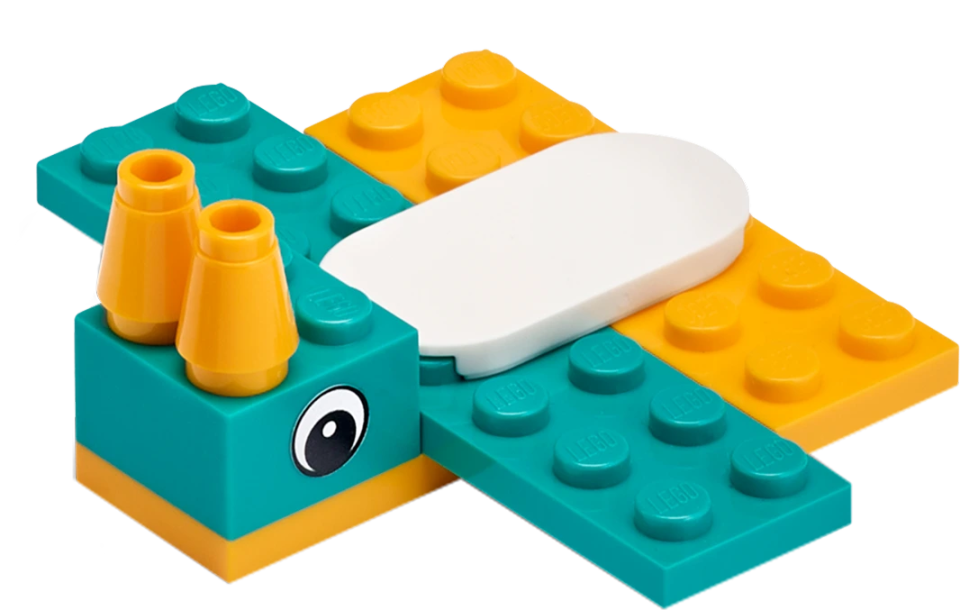
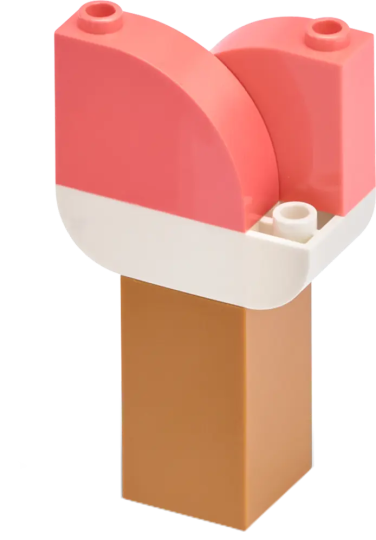
Building Tips
Coding Tips
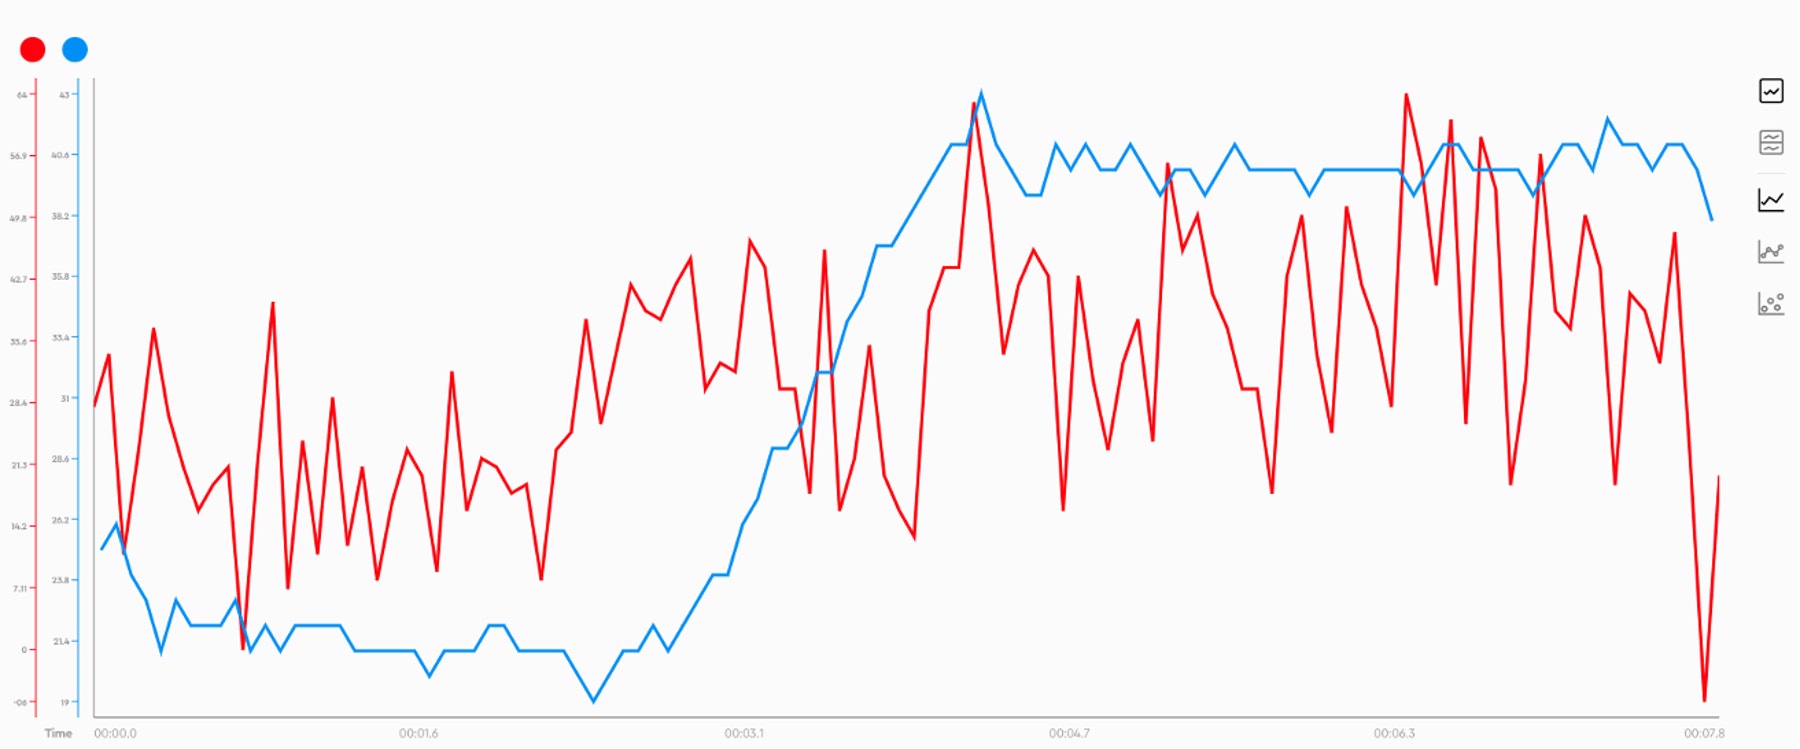
This lesson is designed to be played while the hub is connected through USB or Bluetooth. While connected, the data collected by the Hub is streamed directly to your device and traced in real-time on the Line Graph.
Main Program

Science Data Tips
Here is an example of the data students can expect from this experiment.
Extensions
Math Extension
To incorporate the development of math skills:
- Have your students realize that the two values graphed during this lesson are recorded over time (i.e., angle over time and motor's power over time)
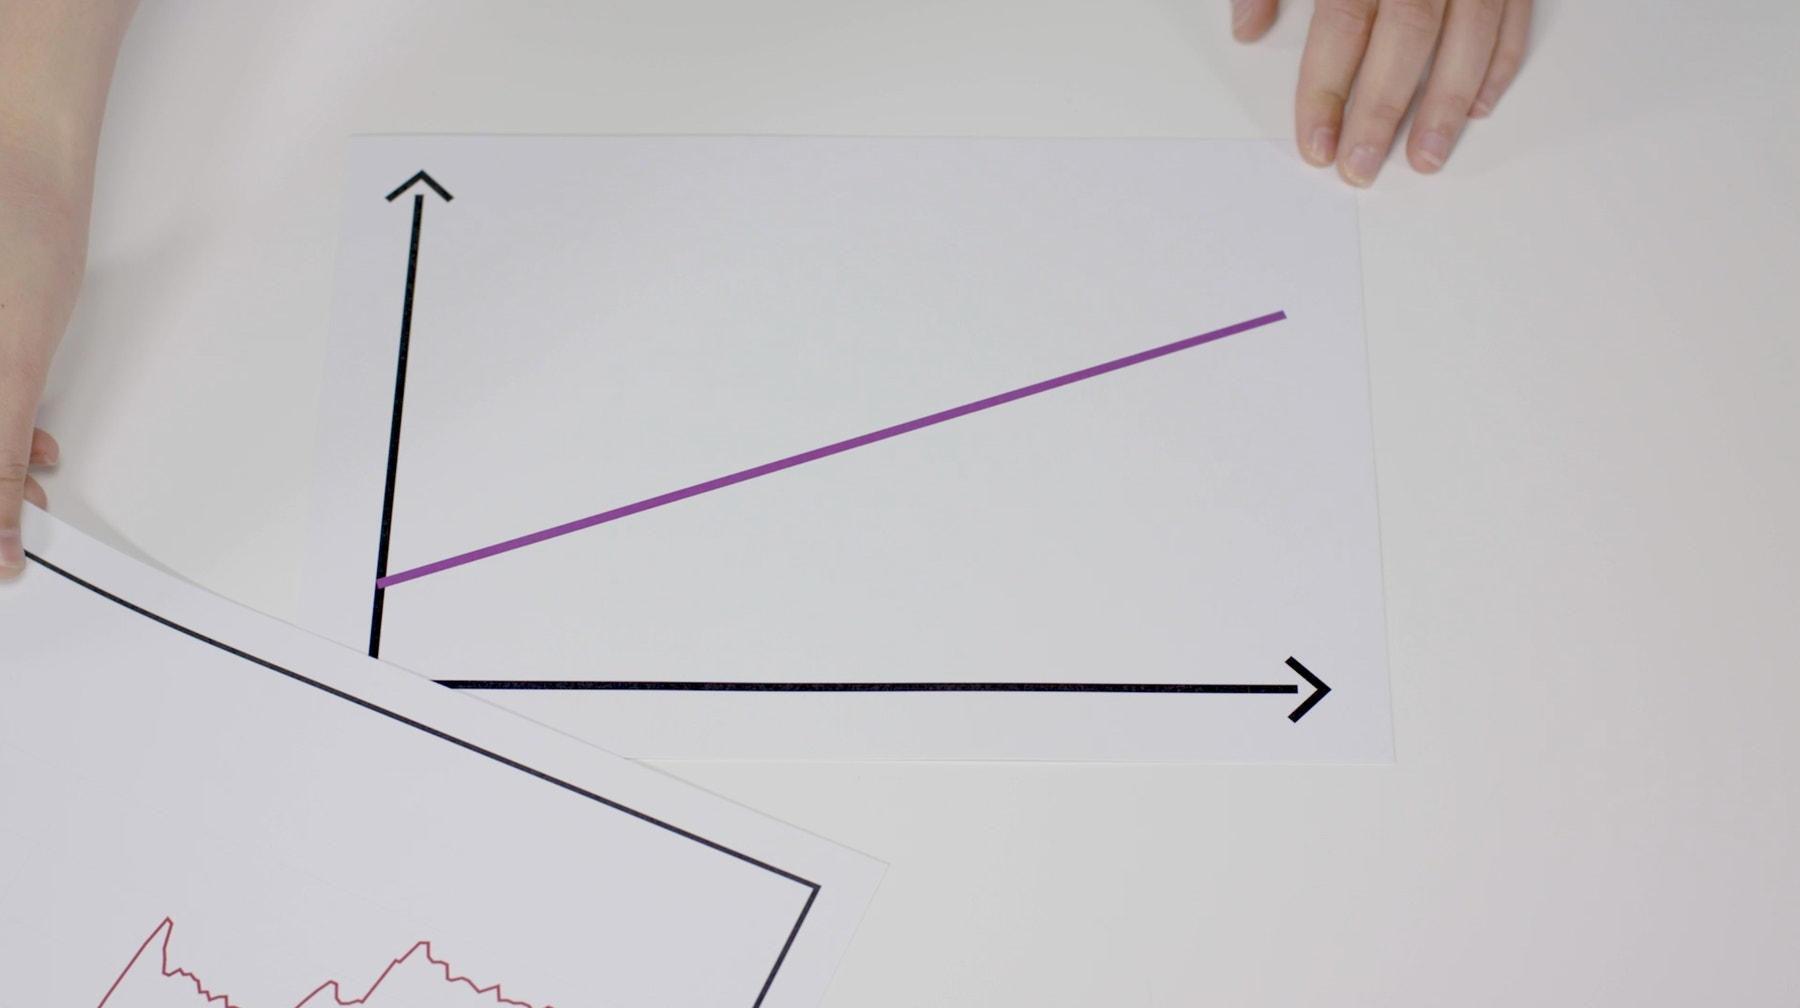
- Have your students perform data manipulations to trace the graph of the motor's power over the angle of the slope, both manually and using online tools.
Note: This will require additional time.
Language Arts Extension
To incorporate the development of language arts skills:
- Have each student write a science inquiry journal, documenting their hypothesis and conclusions as a scientist would.
- Have each student write a newspaper article reporting a major new scientific discovery. Ask them to document the scientific protocols used, as a journalist would.
- Provide examples of scientific newspaper articles and science inquiry journals. Ask your students to compare the two and document their observations.
Note: This will require additional time.
Career Links
Students who've enjoyed this lesson might be interested in exploring these career pathways:
- Health Science
- Education & Training
- Science, Technology, Engineering & Mathematics
- Transportation, Distribution & Logistics
Teacher Support
Students will:
- Perform an experiment that illustrates the transfer of energy, from electric to potential energy
- LEGO® Education SPIKE™ Prime Set
- Device with the LEGO Education SPIKE App installed
- A plank or something to create a slope
NGSS
MS-PS3-4
Plan an investigation to determine the relationships among the energy transferred, the type of matter, the mass, and the change in the average kinetic energy of the particles as measured by the temperature of the sample.
Common Core
CCSS.MATH.CONTENT.7.RP.A.2
Recognize and represent proportional relationships between quantities.
CCSS.MATH.CONTENT.7.RP.A.2.A
Decide whether two quantities are in a proportional relationship, e.g., by testing for equivalent ratios in a table or graphing on a coordinate plane and observing whether the graph is a straight line through the origin.
CCSS.MATH.CONTENT.7.RP.A.2.B
Identify the constant of proportionality (unit rate) in tables, graphs, equations, diagrams, and verbal descriptions of proportional relationships.
CCSS.MATH.CONTENT.7.RP.A.2.C
Represent proportional relationships by equations. For example, if total cost t is proportional to the number n of items purchased at a constant price p, the relationship between the total cost and the number of items can be expressed as t = pn.
CCSS.MATH.CONTENT.7.RP.A.2.D
Explain what a point (x, y) on the graph of a proportional relationship means in terms of the situation, with special attention to the points (0, 0) and (1, r) where r is the unit rate.
CCSS.ELA-LITERACY.W.7.2
Write informative/explanatory texts to examine a topic and convey ideas, concepts, and information through the selection, organization, and analysis of relevant content.
CCSS.ELA-LITERACY.W.7.2.A
Introduce a topic clearly, previewing what is to follow; organize ideas, concepts, and information, using strategies such as definition, classification, comparison/contrast, and cause/effect; include formatting (e.g., headings), graphics (e.g., charts, tables), and multimedia when useful to aiding comprehension.
CSTA
2-CS-02
Design projects that combine hardware and software components to collect and exchange data.
2-DA-09
Refine computational models based on the data they have generated.
ISTE
4a
Students know and use a deliberate design process for generating ideas, testing theories, creating innovative artifacts or solving authentic problems.
4b
Students select and use digital tools to plan and manage a design process that considers design constraints and calculated risks.
4c
Students develop, test and refine prototypes as part of a cyclical design process.
5b
Students collect data or identify relevant data sets, use digital tools to analyze them, and represent data in various ways to facilitate problem-solving and decision-making.
5d
Students understand how automation works and use algorithmic thinking to develop a sequence of steps to create and test automated solutions.