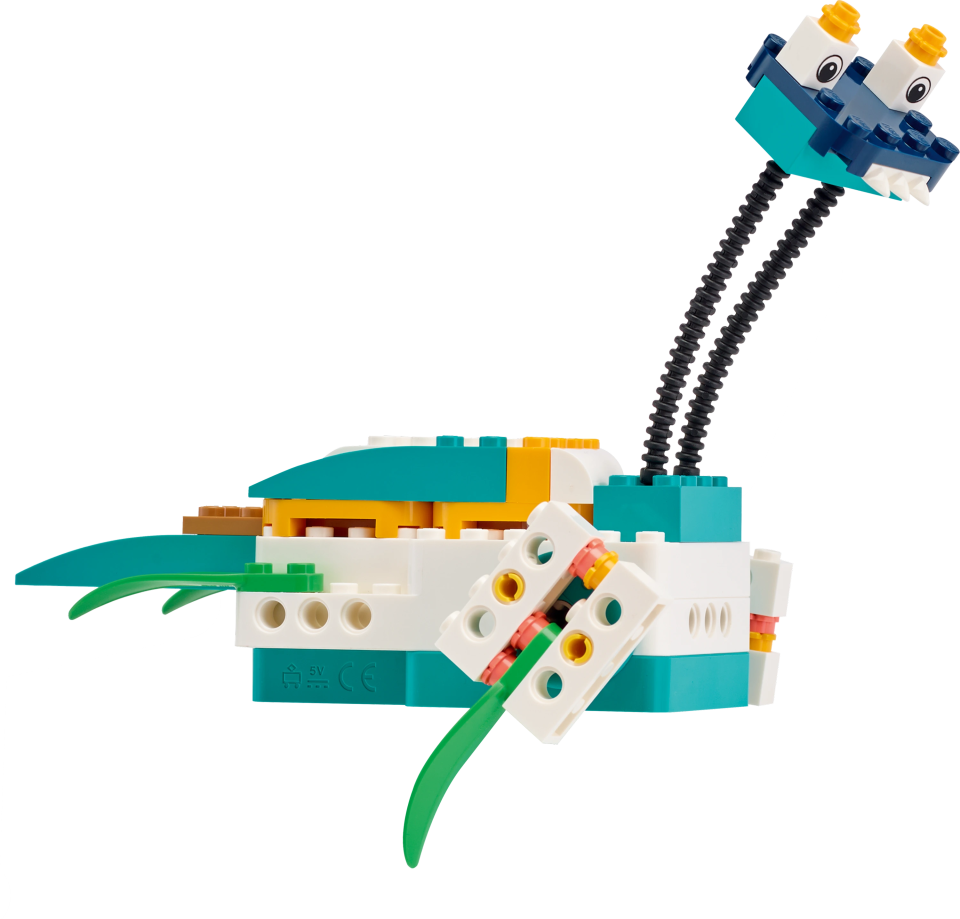
Rain or shine?
Create a way of displaying a weather forecast using qualitative cloud data.

Lesson Plan
1. Prepare
- Read through the student material in the LEGO® Education SPIKE™ App.
2. Engage (5 Min.)
- Use the ideas in the Ignite a Discussion section below to engage your students in a discussion related to this lesson.
- Explain the lesson.
3. Explore (25 Min.)
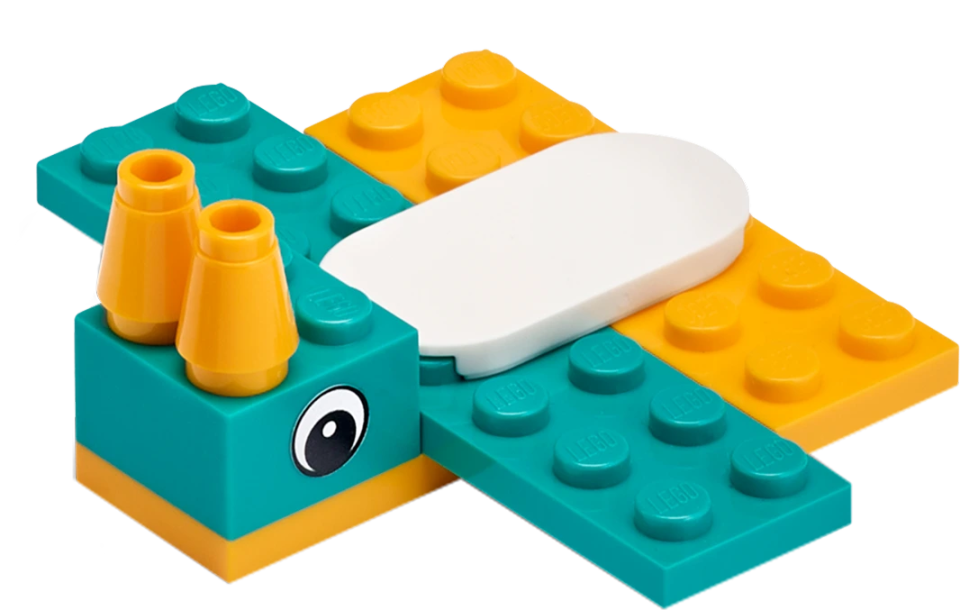
- Have your students work in pairs to build the weather caster.
- Ask them to play the program. Remind them that they must enter a city in order for the program to work. Try first with your current location.
- Tell your students to extend their programs using an "IF ELSE" statement to show if it's raining.
- Have your students create a program that will make the weathercaster describe the weather for the next 5 hours.
- Tell them that they should also consider recording partly cloudy, cloudy, snowing, or foggy conditions in their programs.
4. Explain (5 Min.)
- Discuss how cloud data can be used to control an output.
- Ask your students what they think will happen if the weather block is set to a different country or city.
5. Elaborate (10 Min.)
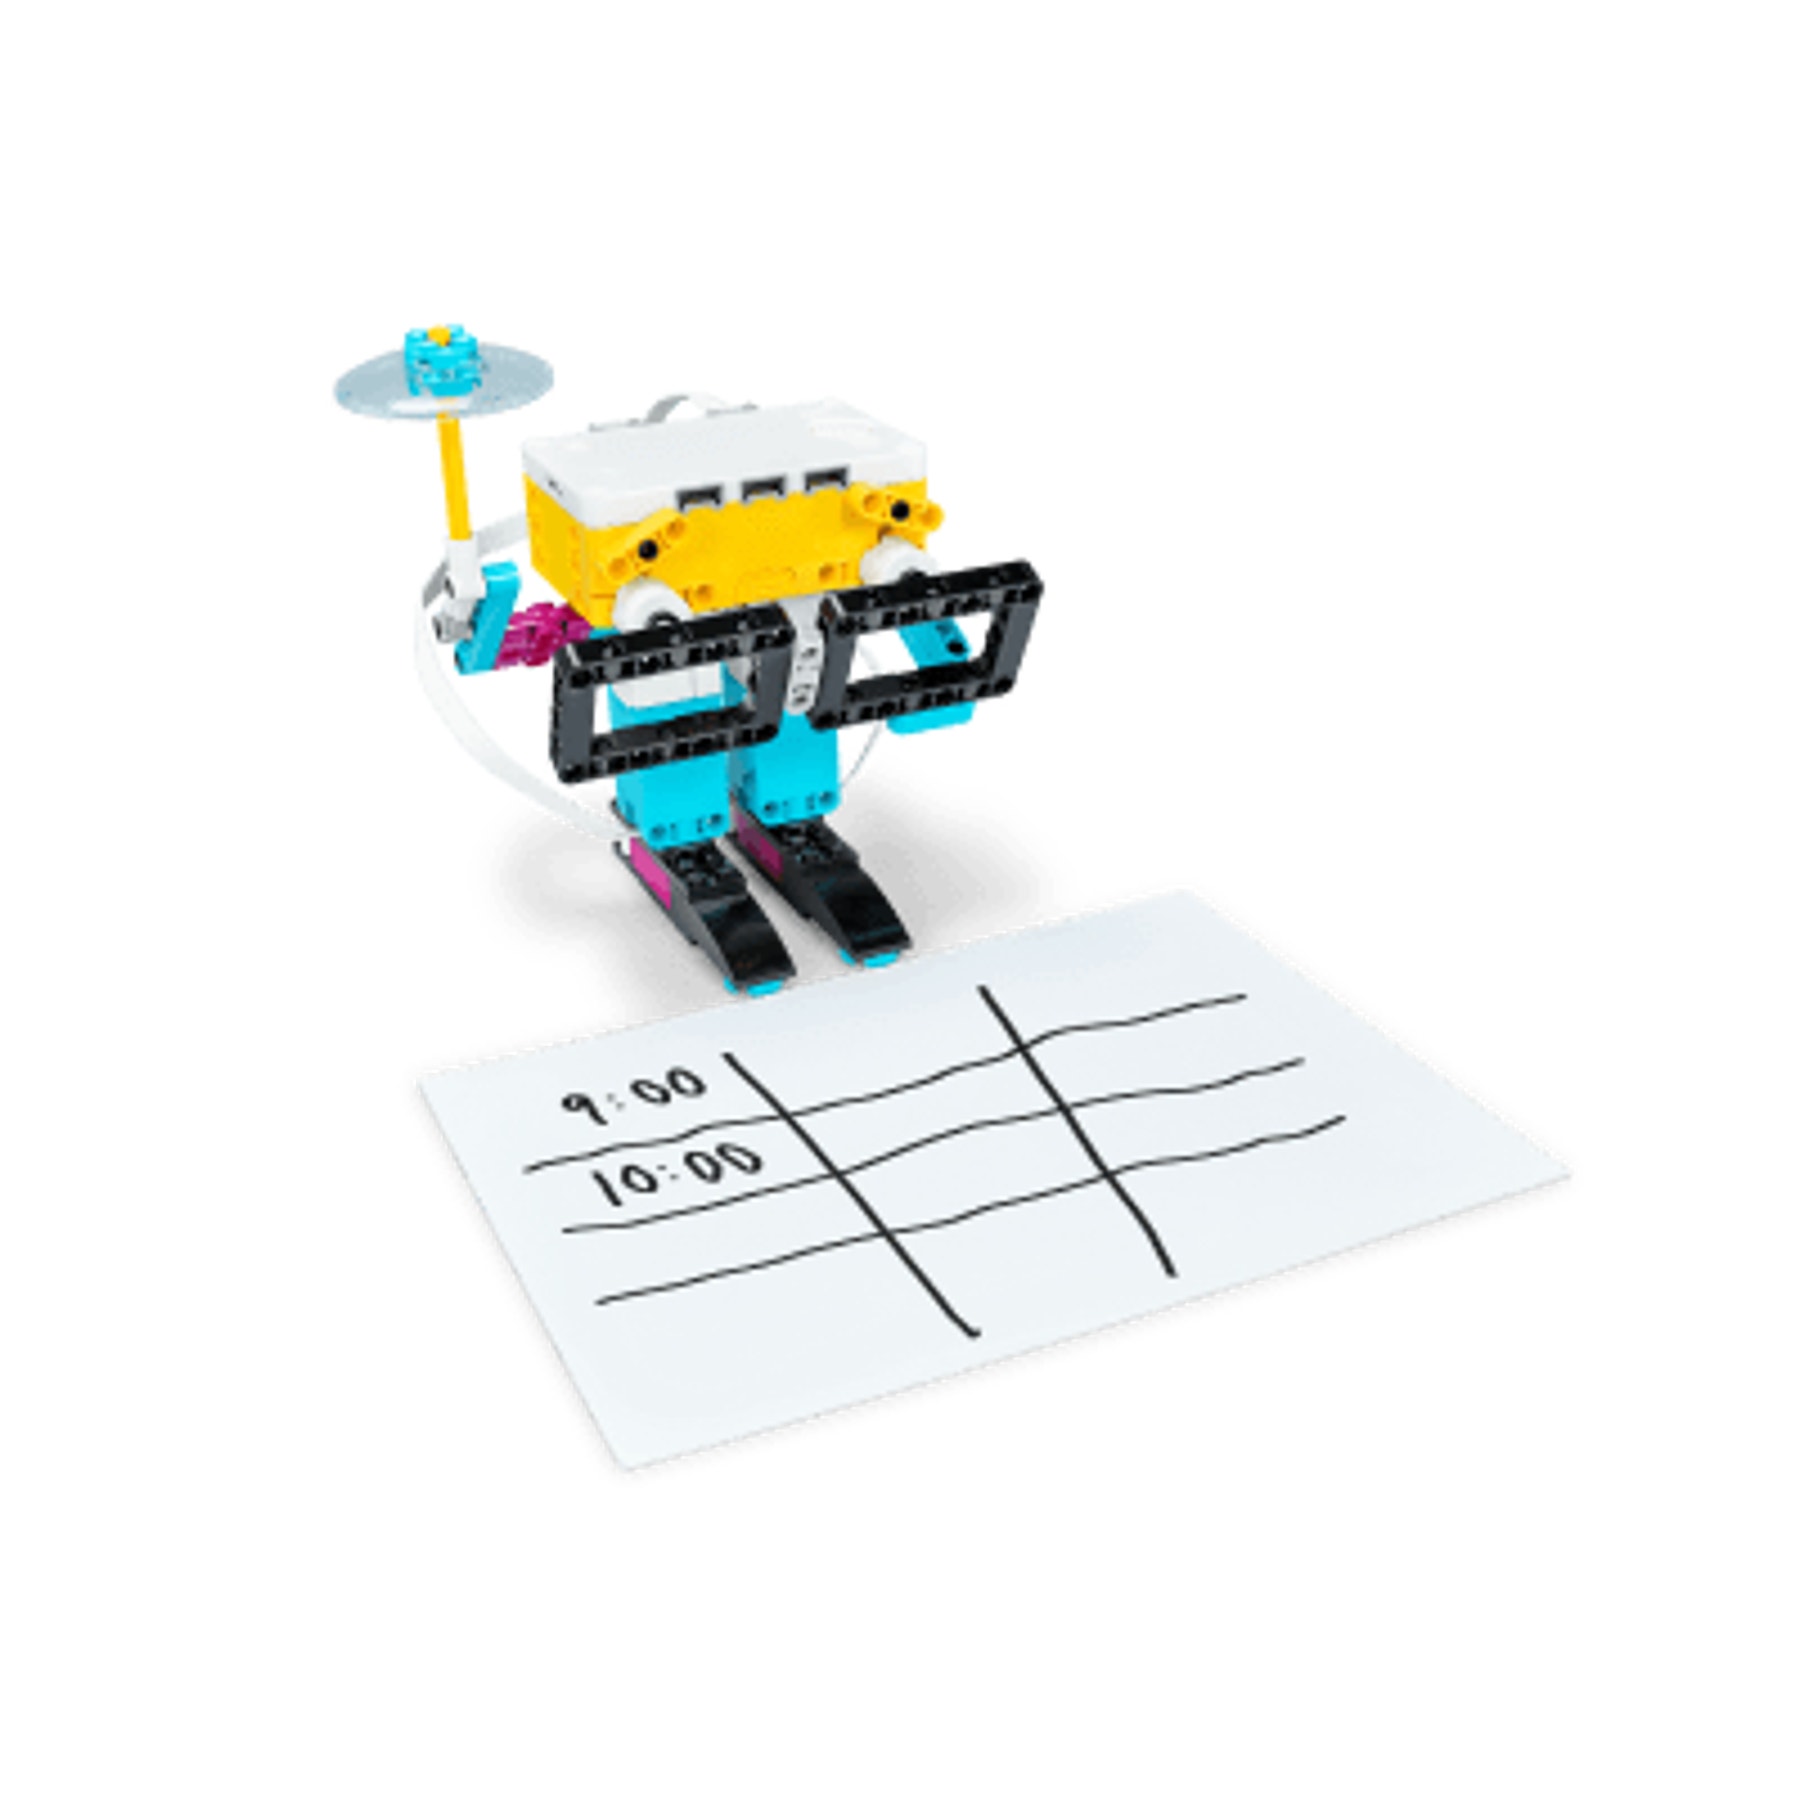
- Ask your students to record the weathercaster's prediction in a table.
- Have them try different cities and record the forecast for at least 2 locations.
- Tell them to record the actual weather during the next 5 hours in their tables and compare their forecast data to the actual data. They can use weather websites or apps to find the current weather in other cities.
- Don't forget to leave some time for cleanup.
6. Evaluate
- Give feedback on each student's performance.
- You can use the assessment rubrics provided to simplify the process.
Ignite a Discussion
Start a discussion about forecasts, weather data, and cloud data.
- Have your students give some example of what they think cloud data is.
- Have them create a definition (e.g., live data is information that's always up to date and comes straight from one source, it can be accessed via the internet).
Have your students watch this video to see what they're about to do.
Building Tips
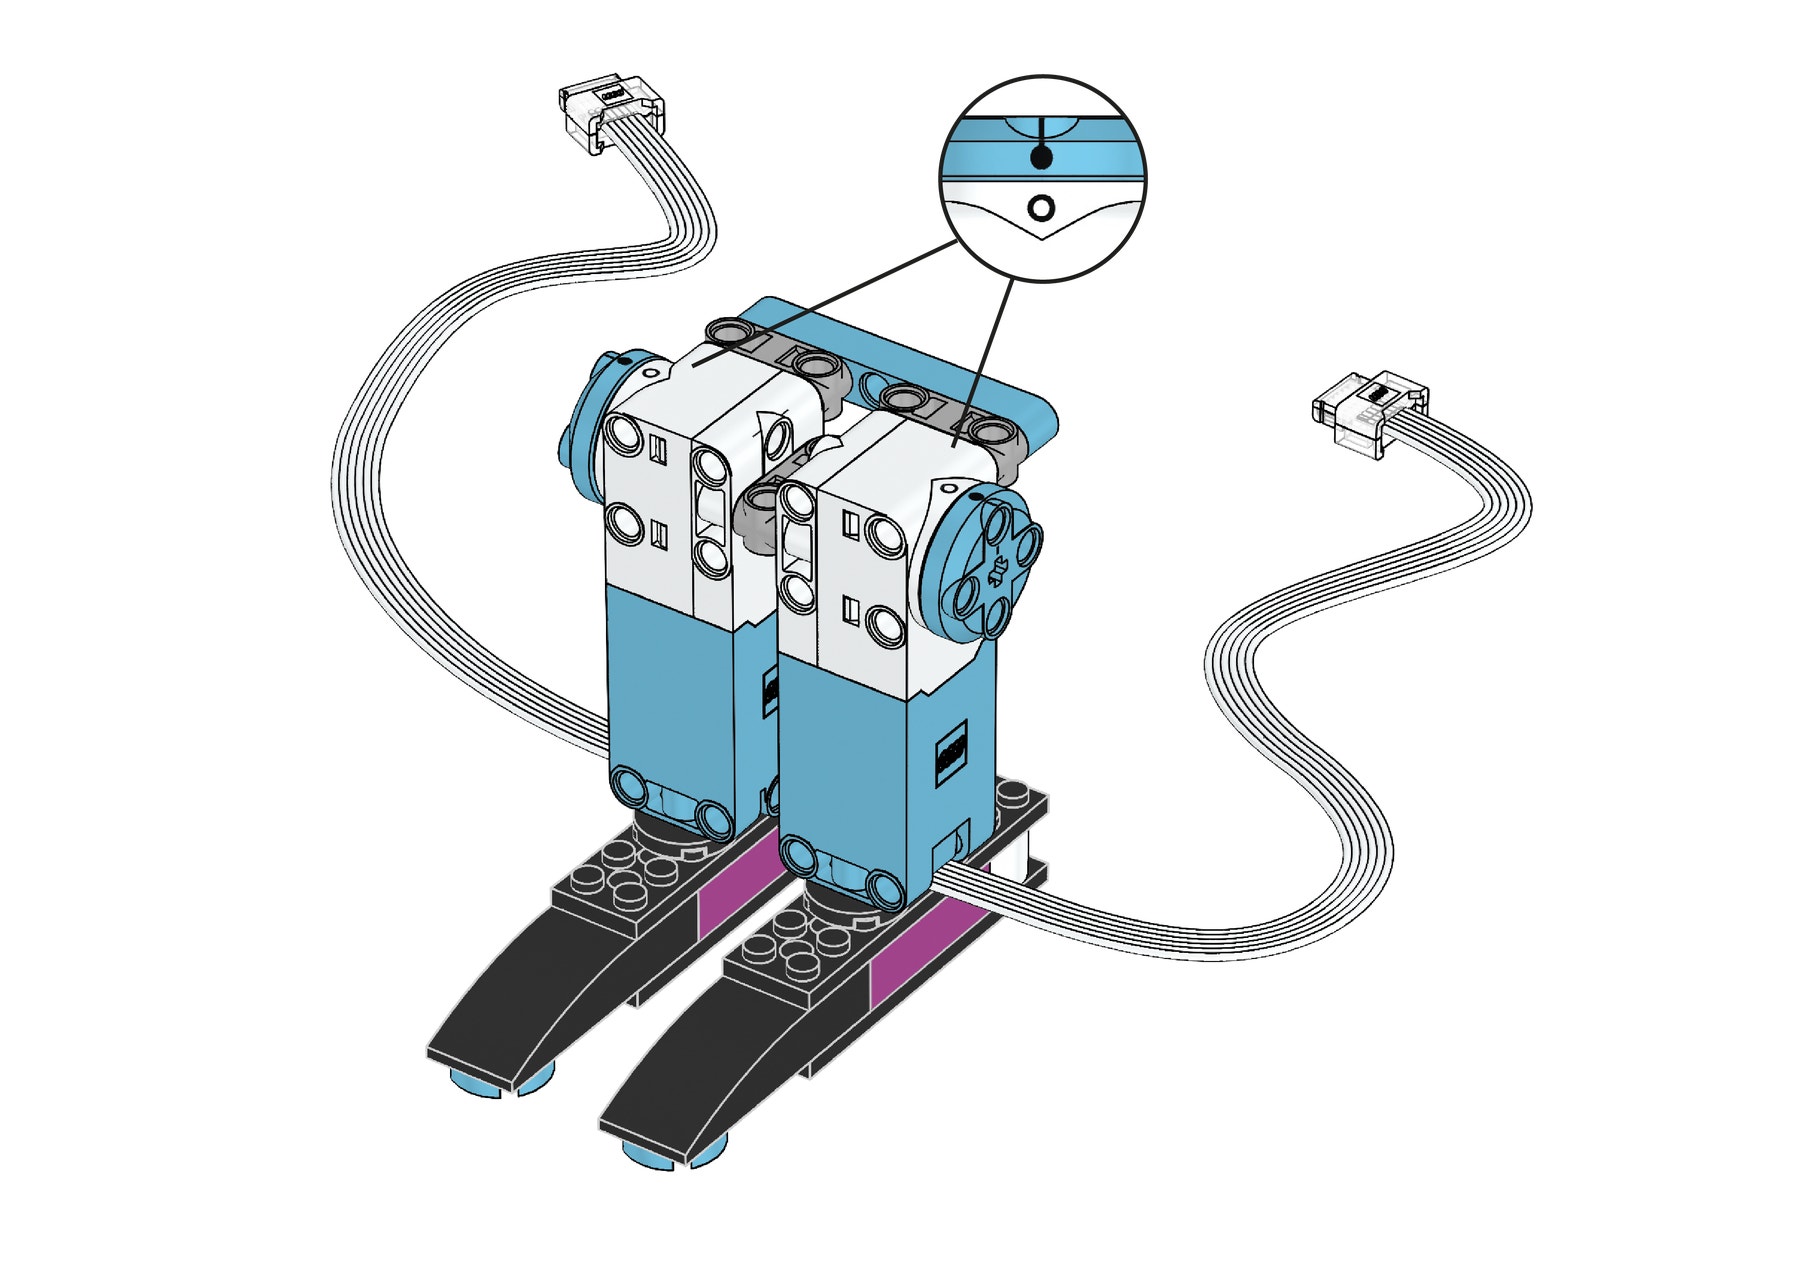
Align Motors Correctly
In order for this lesson to work as intended, ensure that your students have positioned the motors correctly. The motors must be placed at the zero position when the arms are down.
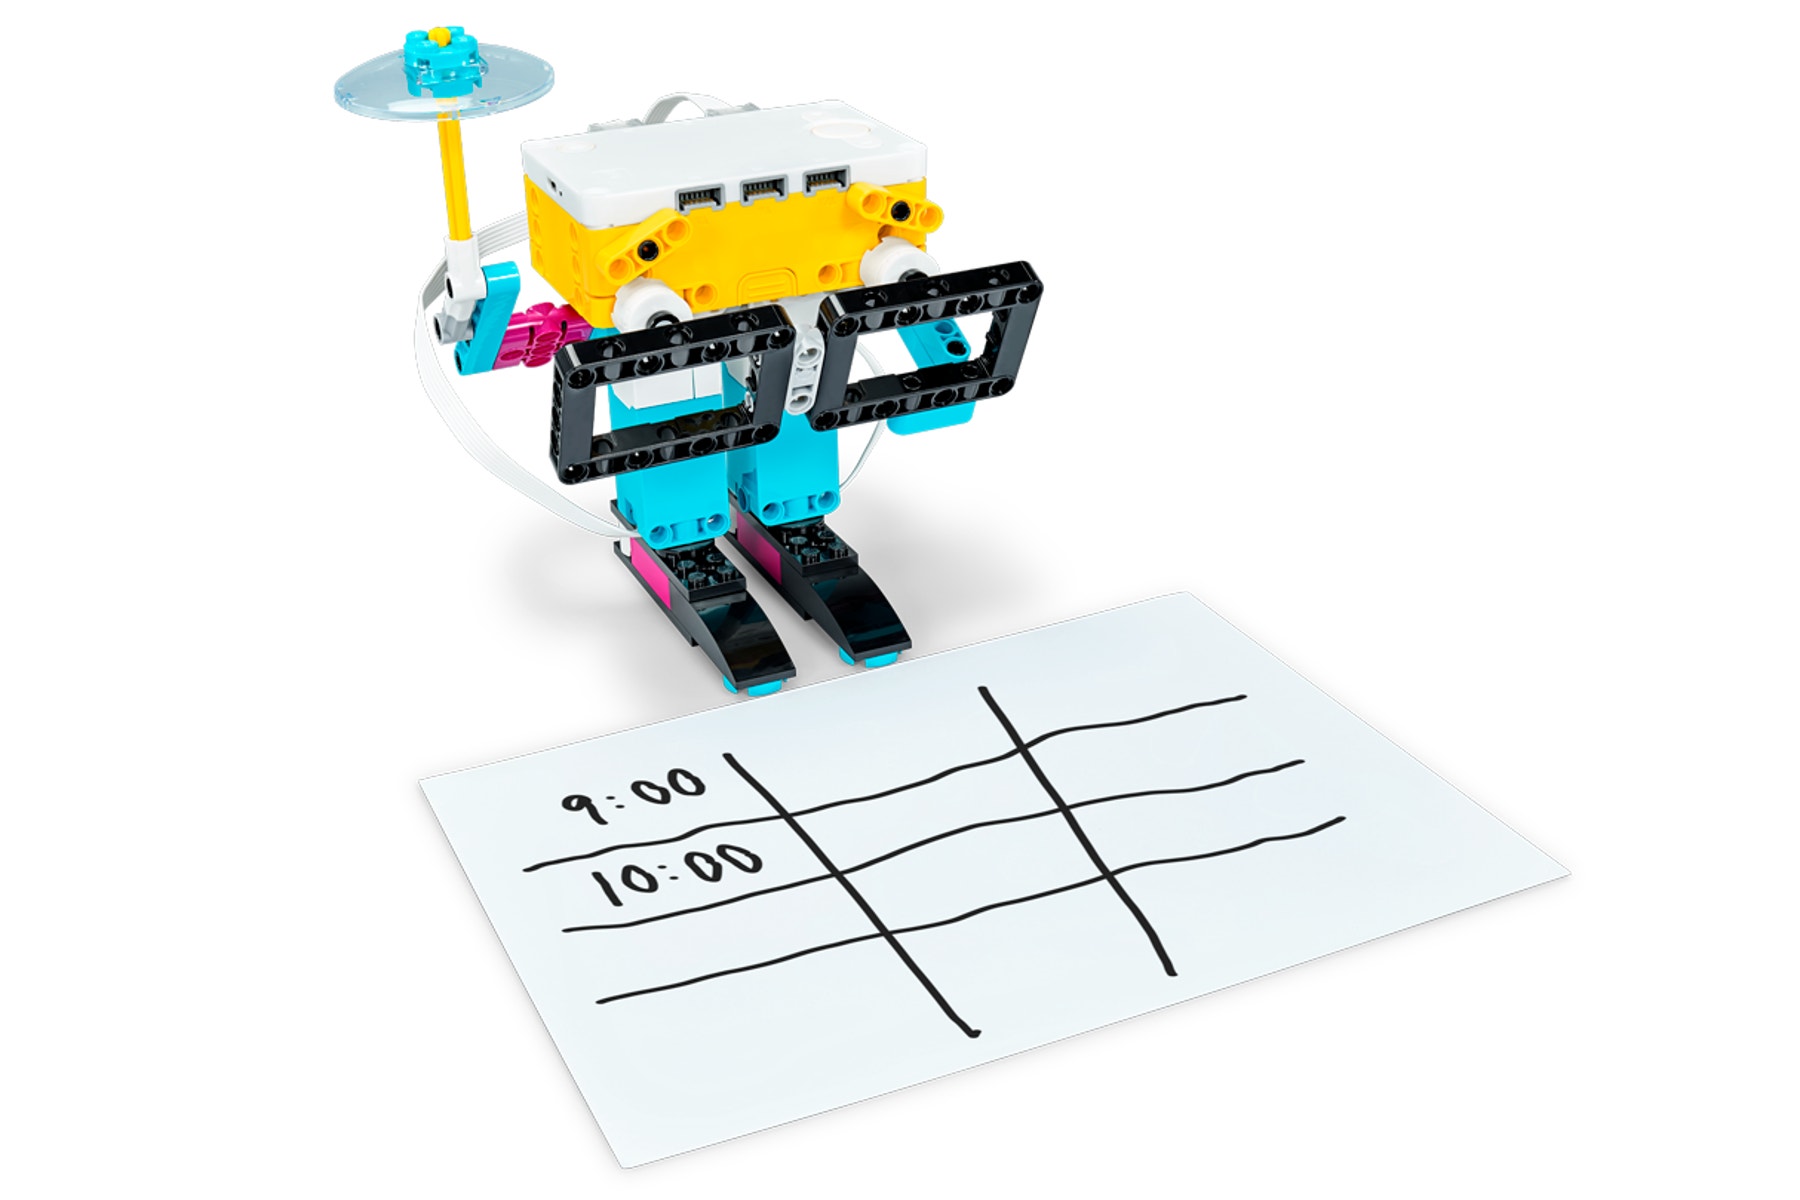
Verify Your Predictions
Use a table like this one or have your students create their own so they can verify the accuracy of their predictions.
Your city's forecast!
Coding Tips
Warning! This may be dangerous!
Weather Blocks will only work when you're online because they fetch real-time data.
Using the Weather Blocks
The weather blocks available in the SPIKE App are based on forecasts, not current values. Students can play around with forecasts up to 240 hours ahead of the current time.
Check out the help section in the SPIKE App to find out more about how to use the Weather Blocks.
Main Program

Possible Solution

Other Programs

Differentiation
Simplify this lesson by:
- Asking your students to only explore cities that have sunshine
Take this lesson to the next level by:
- Displaying a list of random cities from around the world and asking your students which one(s) would be the best for a vacation
- Asking your students to add some extra bricks to personalize their models
Assessment Opportunities
Teacher Observation Checklist
Create a scale that matches your needs, for example:
- Partially accomplished
- Fully accomplished
- Overachieved
Use the following success criteria to evaluate your students' progress:
- Students can accurately describe accurately the concept of cloud data.
- Students can create and use cloud data in their programs.
- Students can use the collected results of cloud data to produce an accurate weather forecast.
Self-Assessment
Have each student choose the brick that they feel best represents their performance.
- Blue: I've created a program to produce an accurate weather forecast for my city.
- Yellow: I've created a program to produce an accurate weather forecast for two cities.
- Violet: I've created a program to produce an accurate weather forecast for two cities and found the best place to go on vacation – beach or skiing?
Peer-Assessment
Encourage your students to provide feedback to others by:
- Having one student score the performance of another using the colored brick scale above.
- Asking them to present constructive feedback to each other so that they can improve their group's performance during the next lesson.
Language Arts Extension
To integrate language arts skills development:
- Have your students play the role of a TV weather forecaster. Watch some online videos about how weather forecasts are presented and have your students create their own presentations using their LEGO models and other presentation materials. They can even suggest good places to go for a long weekend!
Note: This will make for a longer lesson.
Math Extension
To incorporate math skills development:
- Because weather forecasts are trying to predict what will happen in the future, they're not always accurate. Have your students use their two-way tables to calculate the percent accuracy of their data.
Note: This will make for a longer lesson.
Career Links
Students who enjoyed this lesson might be interested in exploring these career pathways:
- Science, Technology, Engineering & Mathematics (Engineering and Technology)
- Science, Technology, Engineering & Mathematics (Science and Math)
Teacher Support
Students will:
- Explore the use of live weather data to control an output
CSTA
2-DA-08 6-8
Collect data using computational tools and transform the data to make it more useful and reliable
Common Core
CCSS.MATH.CONTENT.8.SP.A.4
Understand that patterns of association can also be seen in bivariate categorical data by displaying frequencies and relative frequencies in a two-way table. Construct and interpret a two-way table summarizing data on two categorical variables collected from the same subjects. Use relative frequencies calculated for rows or columns to describe possible association between the two variables.