Wind Speed
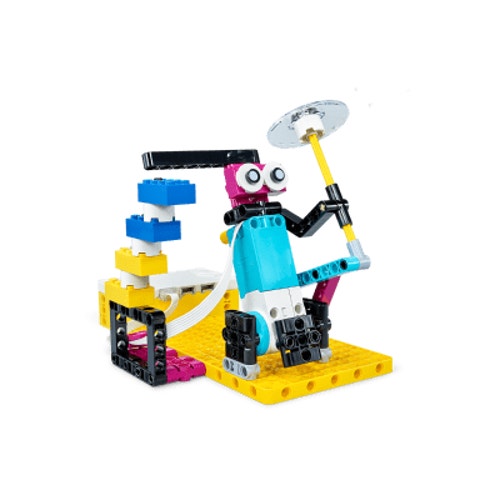
Create a way to display wind speed using quantitative cloud data.
Lesson Plan
1. Prepare
- Read through the student material in the LEGO® Education SPIKE™ App.
2. Engage
- Use the ideas in the Ignite a Discussion section below to engage your students in a discussion related to this lesson.
- Explain the lesson.
3. Explore (20 Min.)
- Have your students work in pairs to build the wind indicator.
- Ask them to play the program. Observe their reactions. Remind them that they must enter a city in order for the program to work.
4. Explain (5 Min.)
- Ask your students to explain how the data coming from the cloud is displayed on the model and how it represents the Beaufort scale.
5. Elaborate (15 Min.)
- Have your students extend their programs with more "IF ELSE" conditions to account for different wind speeds according to the Beaufort scale. They can do this by dividing the scale into 4 parts.
- Ask your students to display wind direction within their programs (e.g., by using arrows on the Light Matrix).
- Don't forget to leave some time for cleanup.
6. Evaluate
- Give feedback on each student's performance.
- You can use the assessment rubrics provided to simplify the process.
Ignite a Discussion
Start a discussion about wind.
- Talk about the things you can and can’t do on windy days (e.g., flying a drone or a kite, playing football or baseball, having an outdoor party).
- Explore various wind speed classifications (e.g., the Beaufort Scale).
- Ask your students to think about the different ways wind can be measured.
Have your students watch this video to see what they're about to do.
Building Tips
Align Motors Correctly
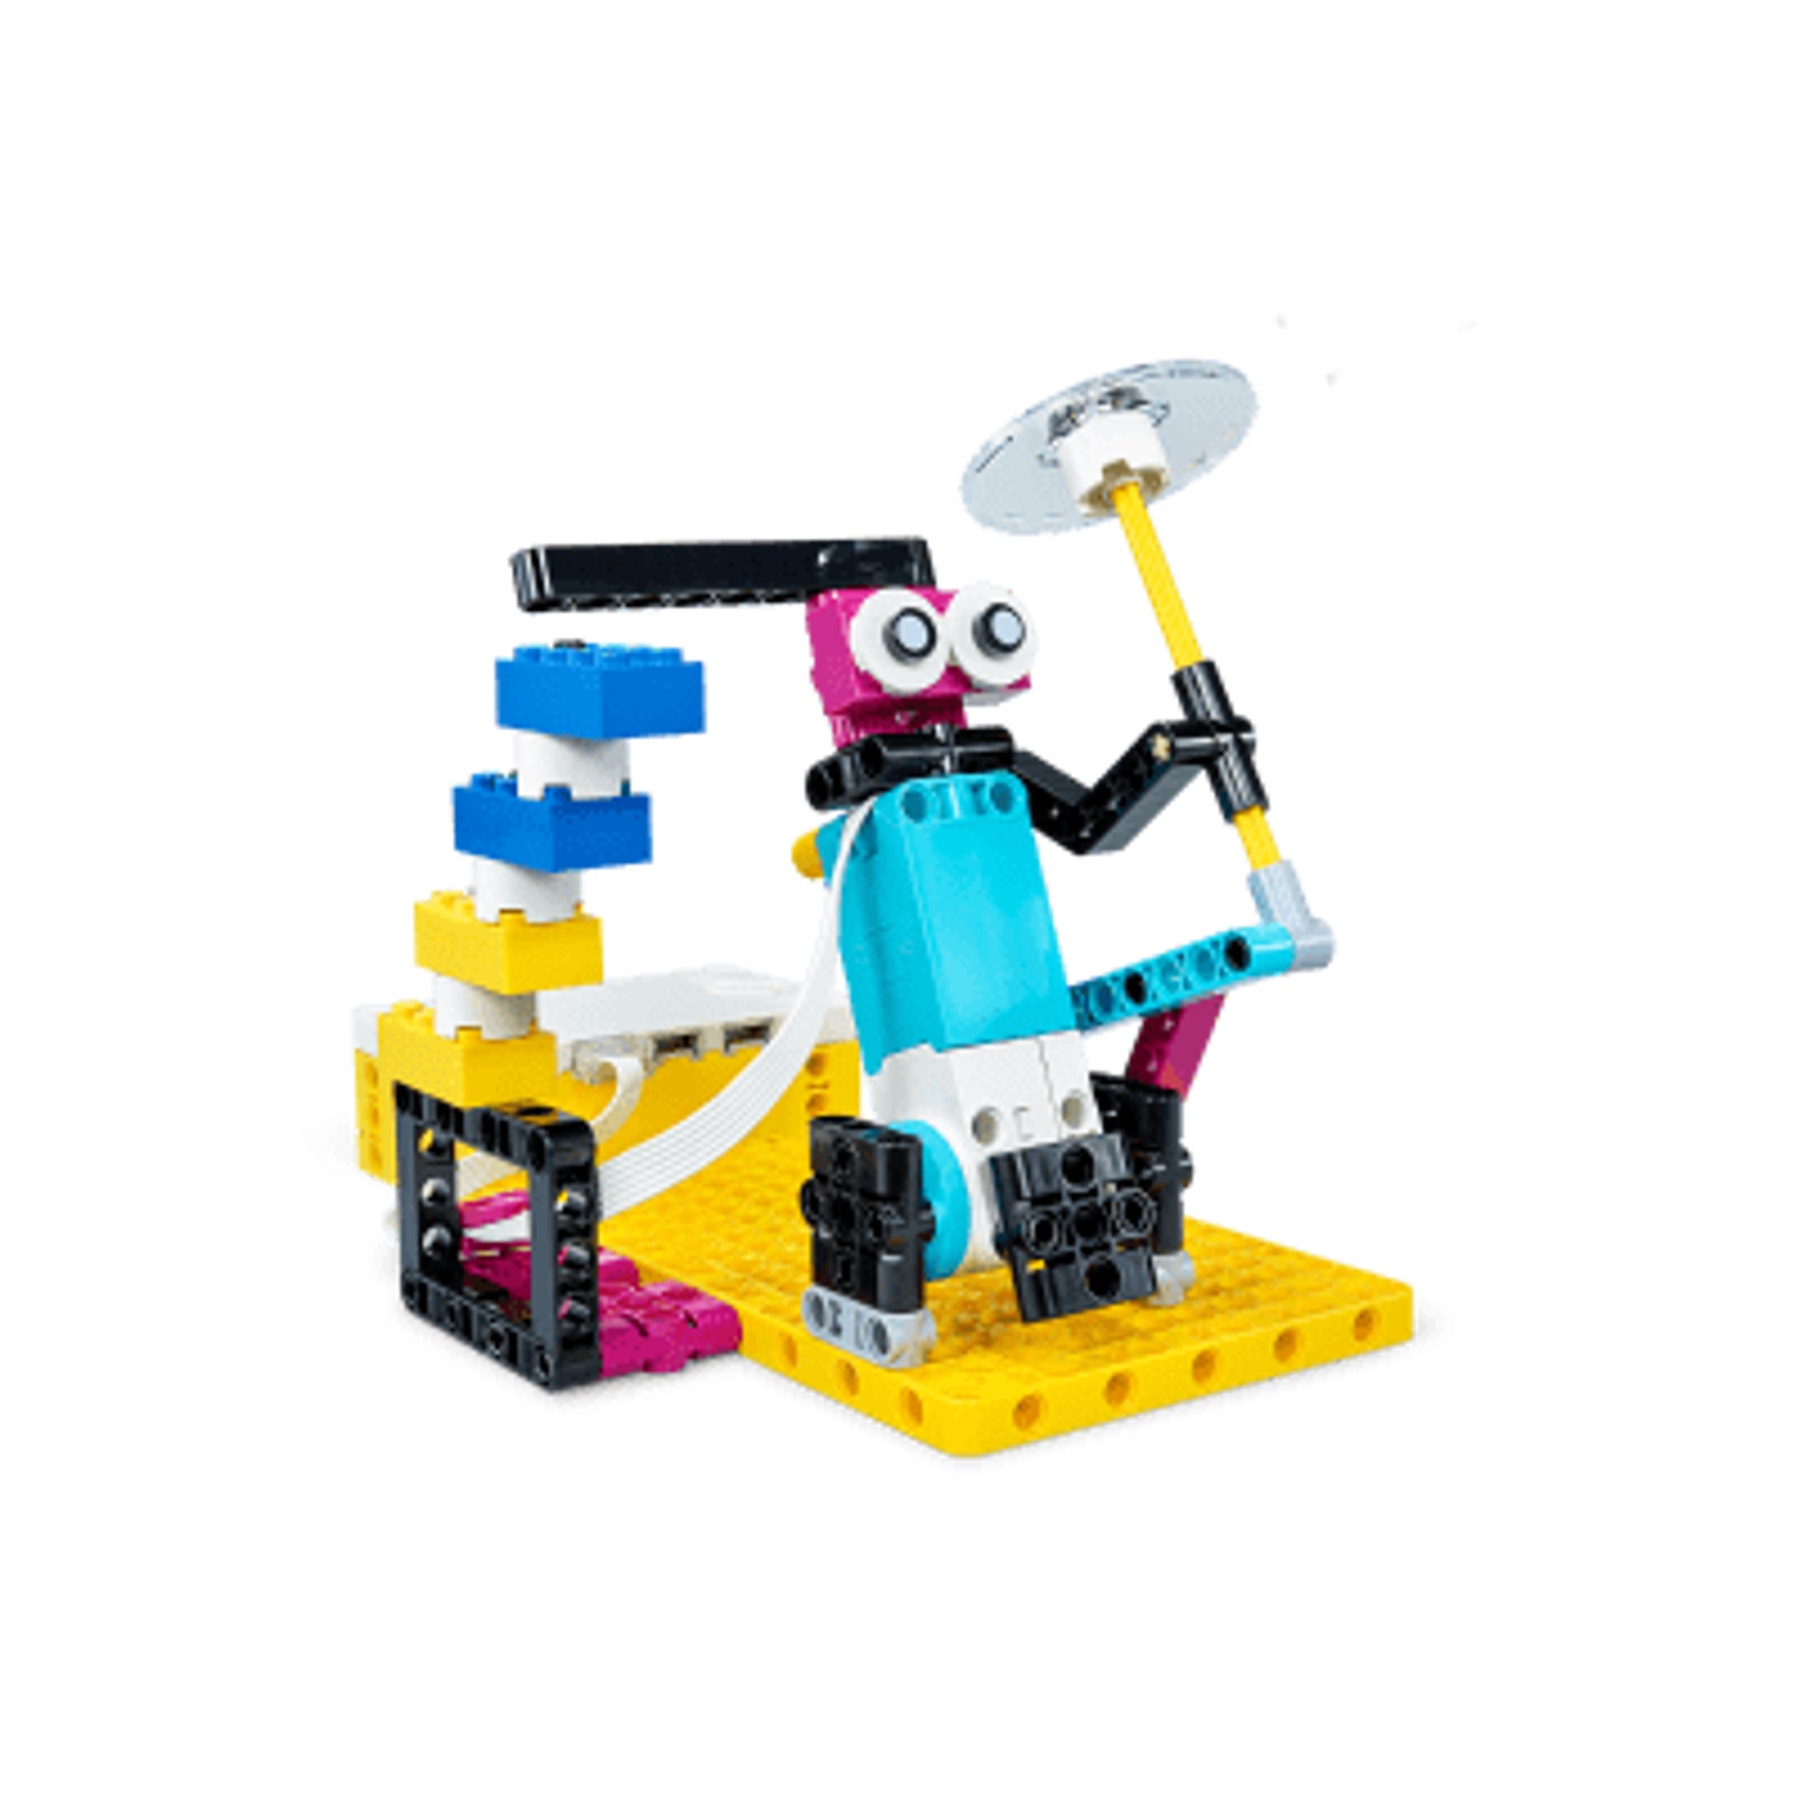
Make sure your students have positioned the motor correctly during building. This will influence how this model is programmed.
Repurpose the Model for Other Lessons
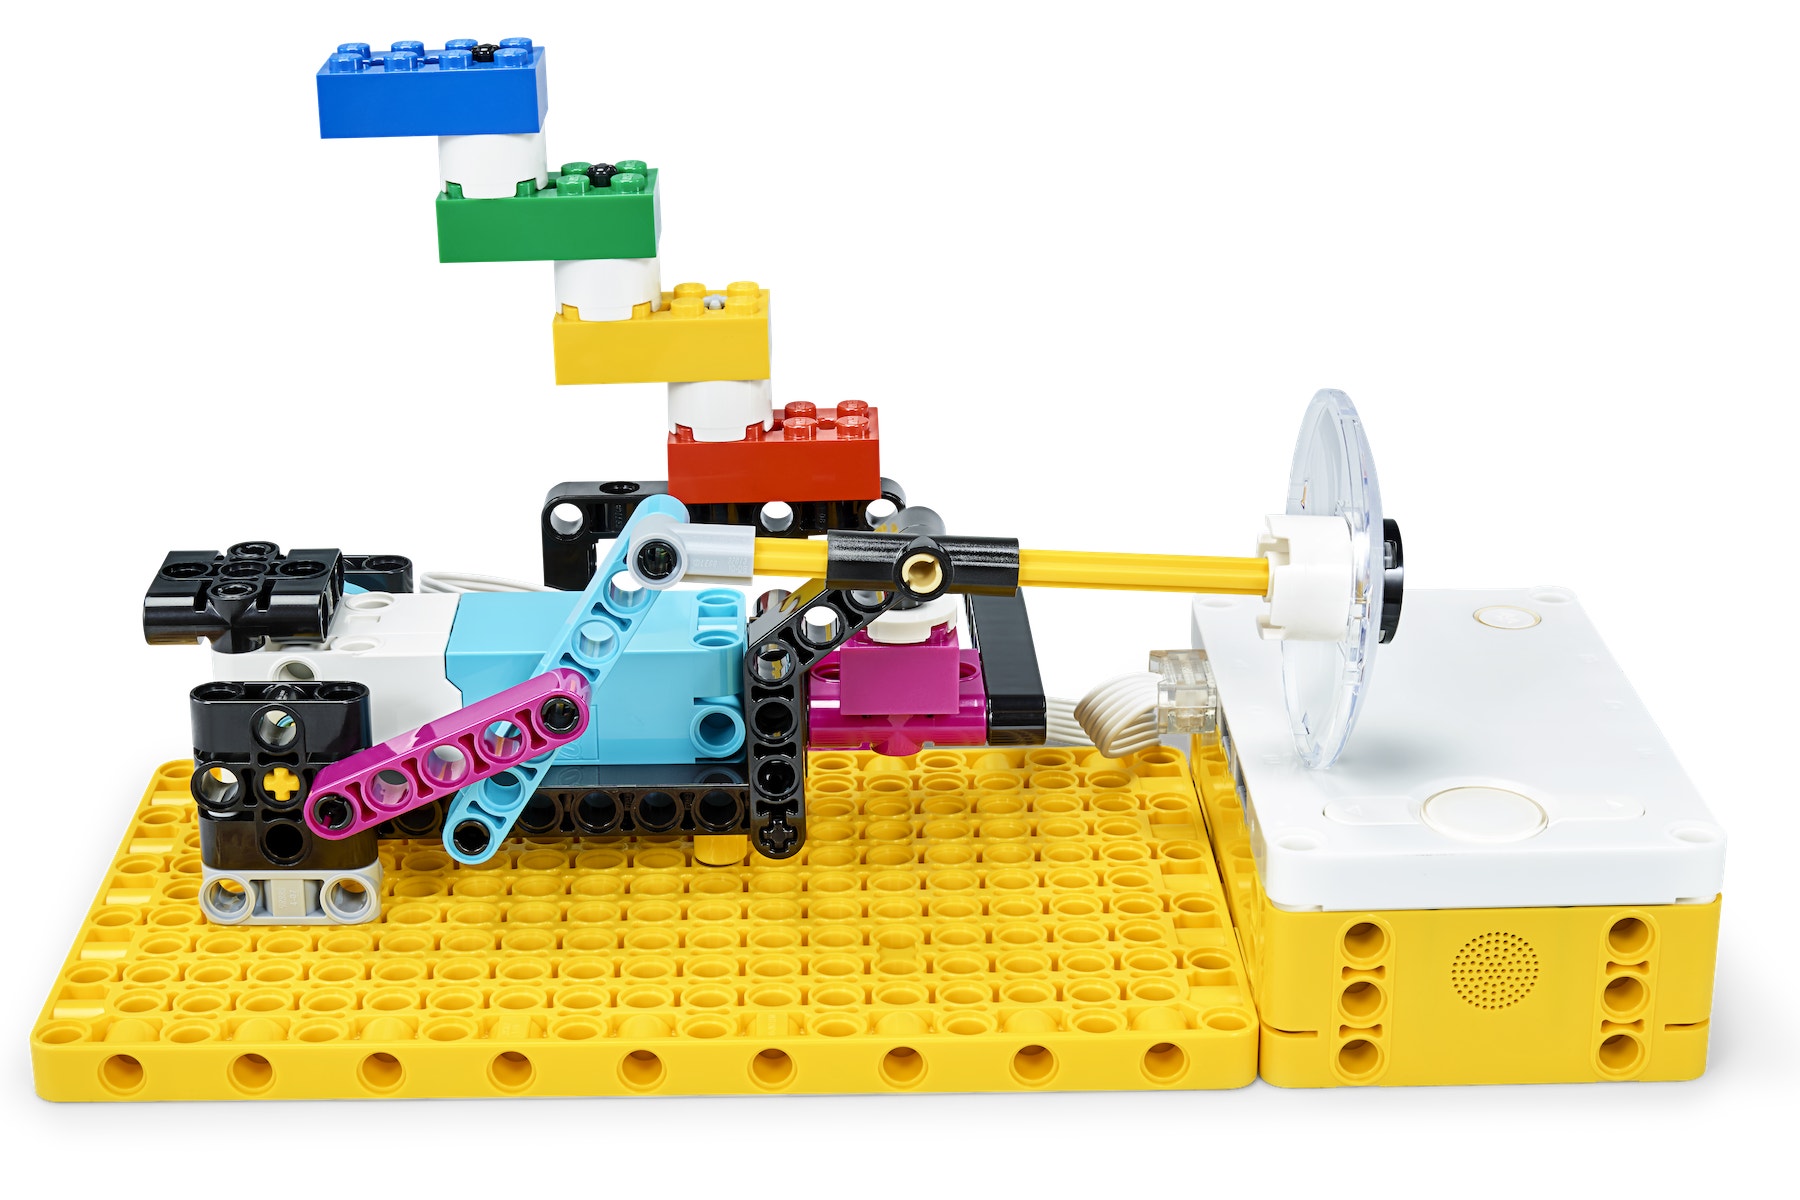
If time is limited, use a basic version of the model (i.e., skip the character elements).
Use the Light Matrix
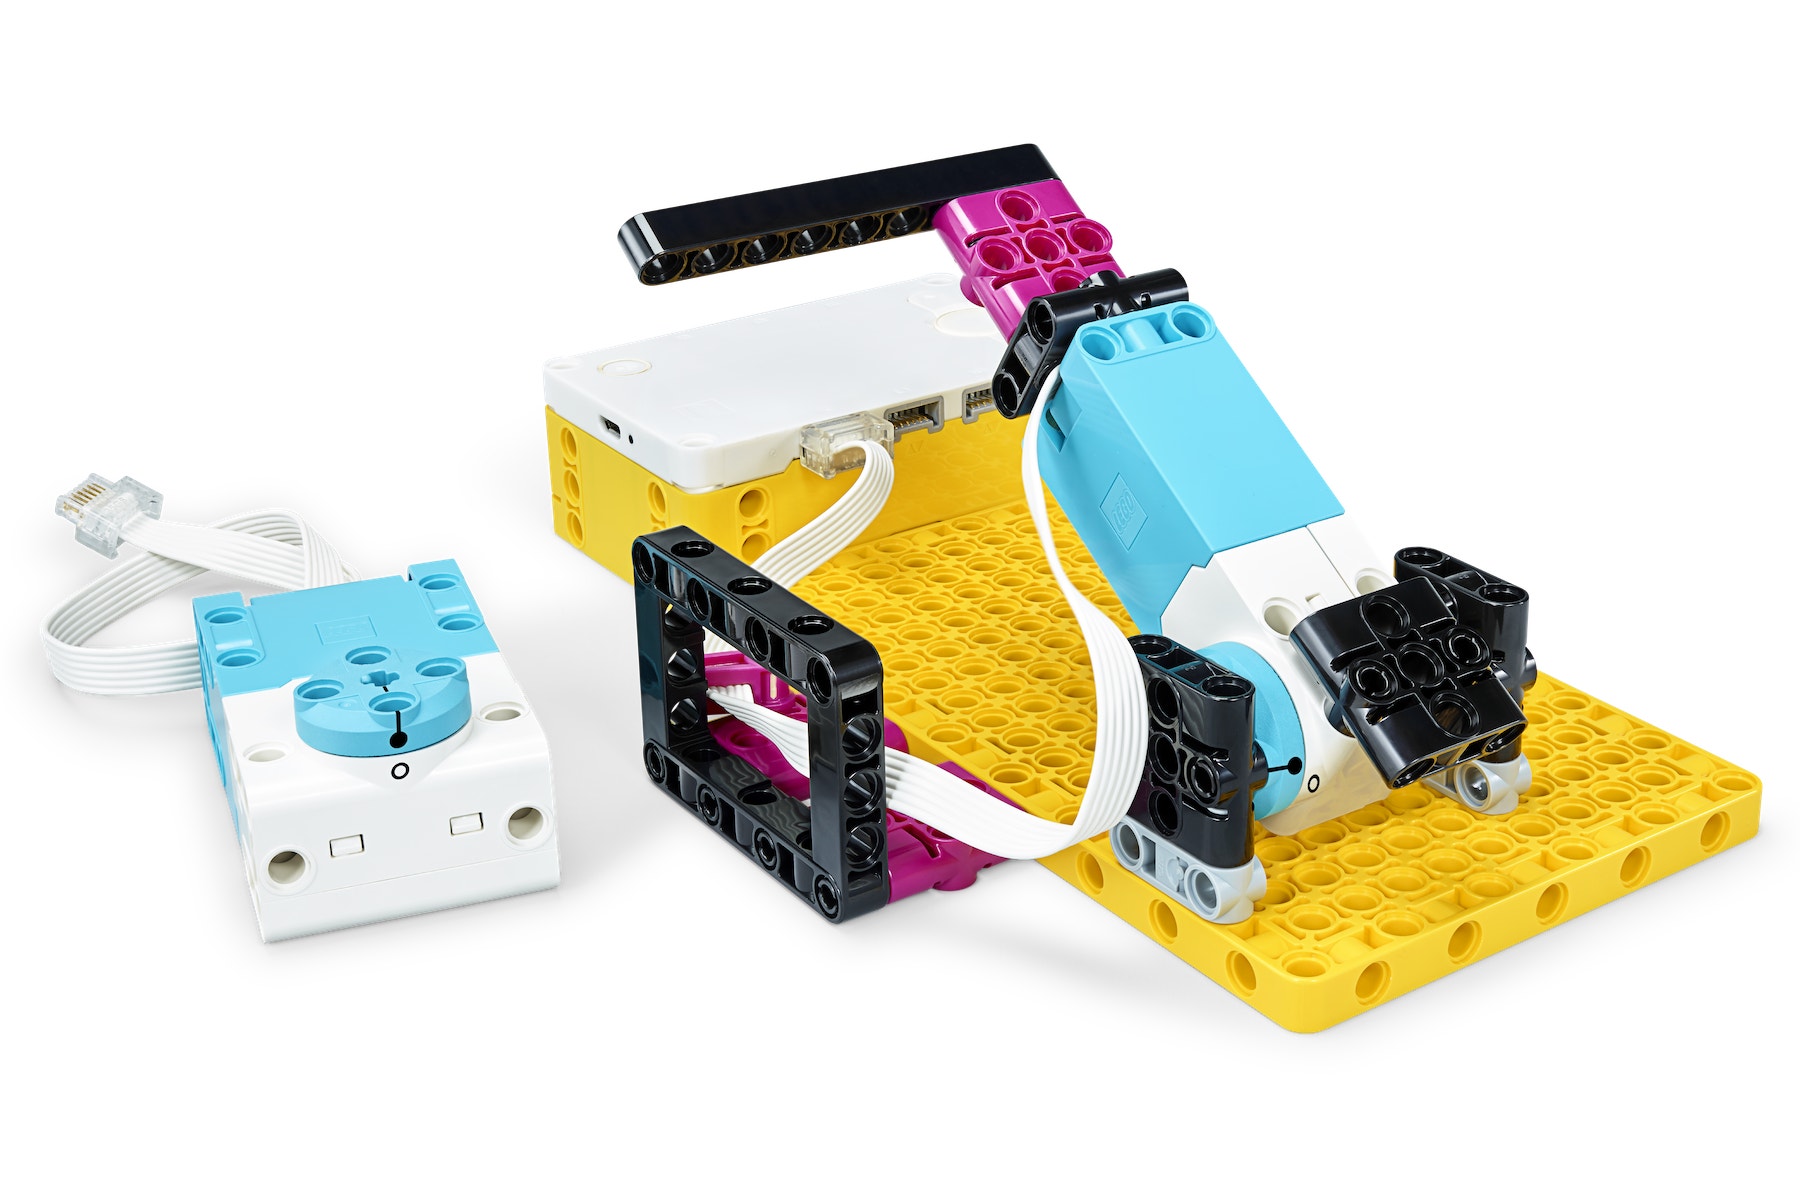
You can use another motor, or arrows on the Hub Light Matrix to display the wind direction.
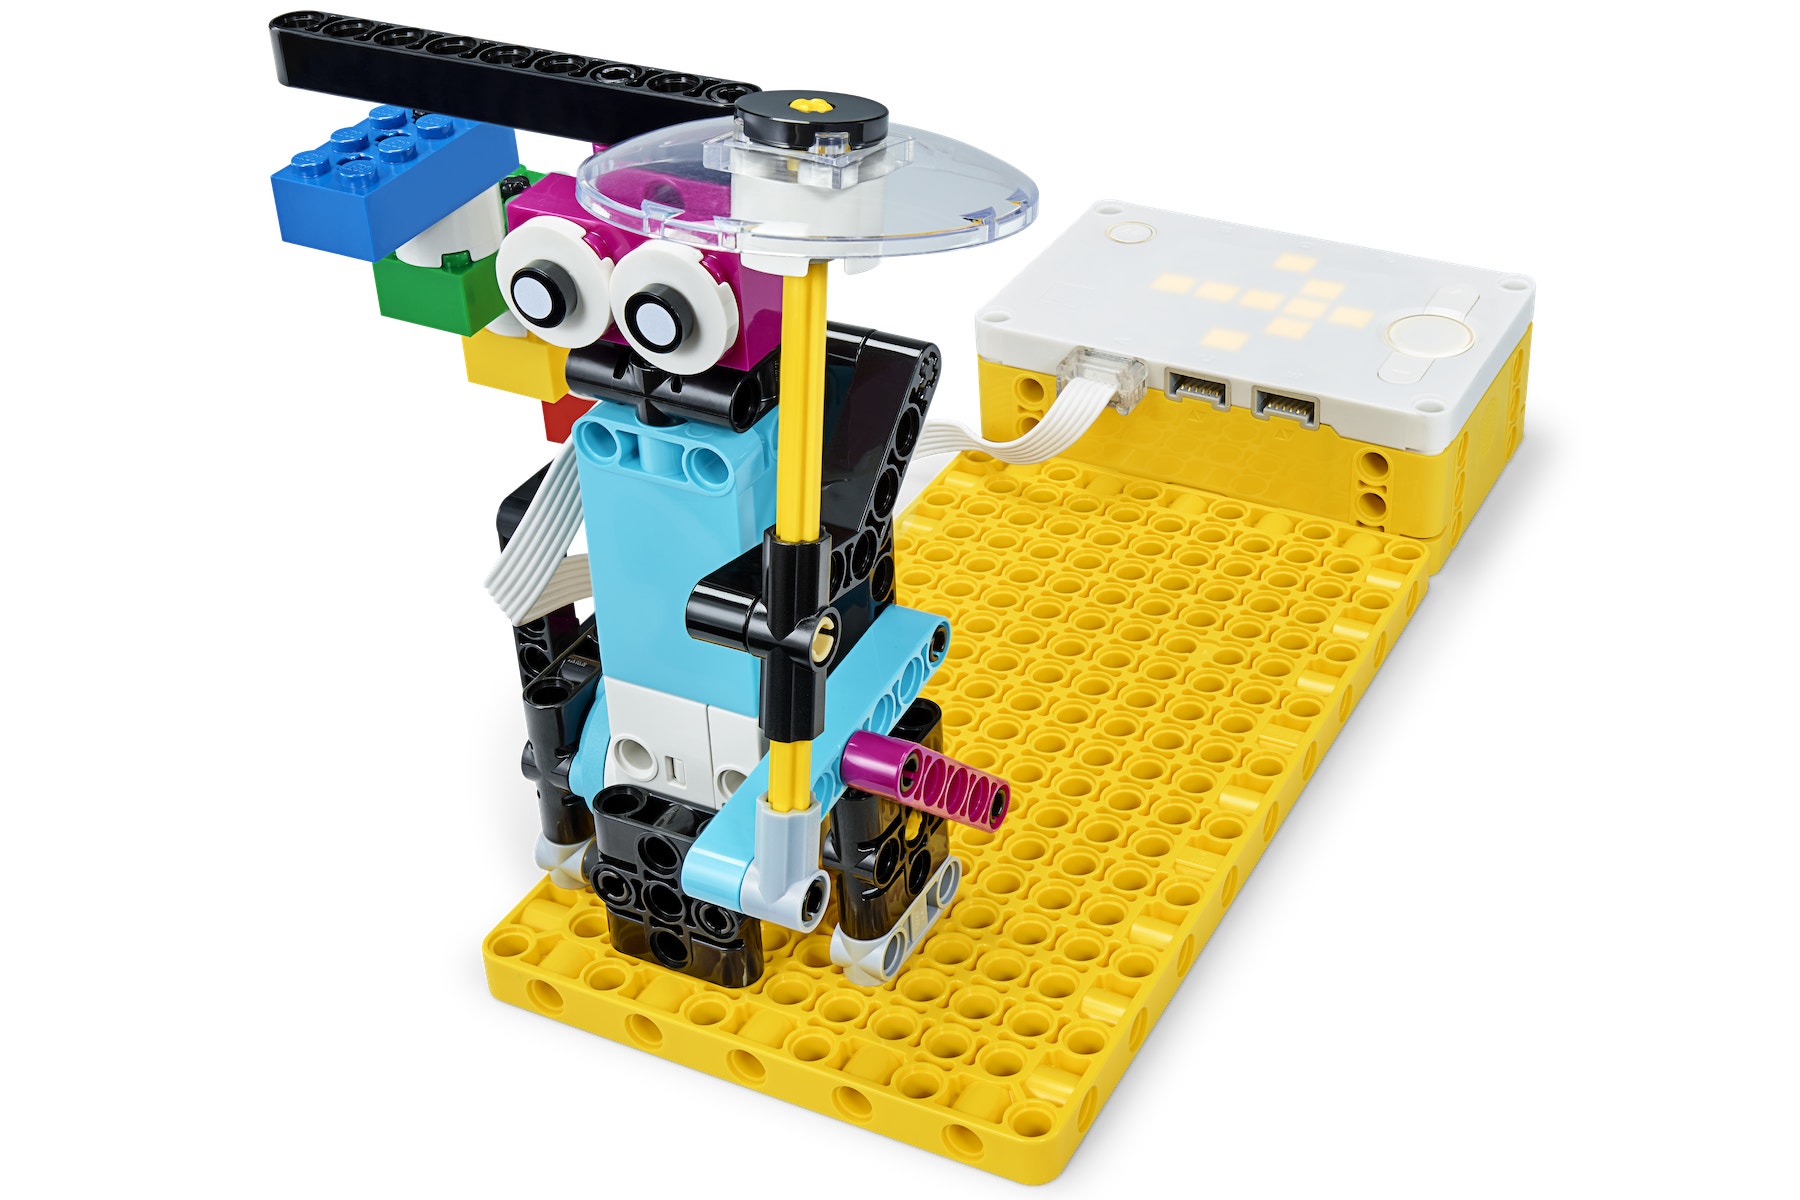
The Beaufort Scale
The brick colors on the model correspond to the Beaufort Scale, which was created in 1805 by the Irish hydrographer Francis Beaufort. It's described like this:
- Blue: Beaufort Scale 1-3 (1 to 12 mph or 0.5 - 5.5 m/s), light to gentle breeze
- Green: Beaufort Scale 4-6 (13 to 31 mph or 5.5 - 13.8 m/s), moderate to fresh breeze
- Yellow: Beaufort Scale 7-9 (31 to 54 mph or 13.8 - 24.4 m/s), strong wind to very strong wind
- Red: Beaufort Scale 10-12 (55 to greater than 73 mph or 24.4 - 32.7 m/s), storm to hurricane

Coding Tips
Main Program

Possible Solution

Other Programs

Differentiation
Simplify this lesson by:
- Conducting a brief unplugged activity to help students visualize the wind speed range associated with the different colors. Use the PDF provided for inspiration.
Take this lesson to the next level by:
- Modifying the wind indicator so it can move in a range of 180 degrees. Observe how quickly your students can recalibrate.
- Asking your students to design their own wind indicators.
Assessment Opportunities
Teacher Observation Checklist
Create a scale that matches your needs, for example:
- Partially accomplished
- Fully accomplished
- Overachieved
Use the following success criteria to evaluate your students' progress:
- Students can use conditional statements to calibrate their scale.
- Students can calibrate their scale no matter what data they use (data units).
- Students can modify their program to collect and use two different types of cloud data simultaneously (wind speed and wind direction).
Self-Assessment
Have each student choose the brick that they feel best represents their performance.
- Blue: I've programmed my model using cloud weather data to show two different wind speeds from three separate locations.
- Yellow: I've programmed my model to read four different categories of wind speed from the Beaufort Scale from three separate locations.
- Violet: I've added and programmed an extra motor with a dial to show the wind direction in each location.
Peer-Assessment
Encourage your students to provide feedback to others by:
- Having one student score the performance of another using the colored brick scale above.
- Asking them to present constructive feedback to each other so that they can improve their group's performance during the next lesson.

Language Arts Extension
To incorporate language arts skills development:
- Have your students record and issue warnings based on their wind speed weather forecasts.
- As part of their forecast, encourage them to also explain how the wind works.
Note: This will make for a longer lesson.
Math Extension
To incorporate math skills development:
- When your students are programming the motor angle to show the wind speed;
▷ Explain that they're interpreting statements about the relative position of two numbers
▷ Explain that they're writing statements of order for rational numbers in this real-world context (e.g., they write "a wind speed of 13.8 > 24.4 m/s" to express the fact that the wind speed is faster). They'll choose units of an appropriate size for measurements, and program the motor to move the angle proportionally. - Have your students work with different units (e.g., mph, kph, knots).
Note: This will make for a longer lesson.
Career Links
Students who enjoyed this lesson might be interested in exploring these career pathways:
- Science, Technology, Engineering & Mathematics (Engineering and Technology)
- Science, Technology, Engineering & Mathematics (Science and Math)
Teacher Support
Students will:
- Explore the use of live weather data to control an output
CSTA
2-DA-08
Collect data using computational tools and transform the data to make it more useful and reliable.
Common Core
CCSS.MATH.CONTENT.8.EE.A.4
Perform operations with numbers expressed in scientific notation, including problems where both decimal and scientific notation are used. Use scientific notation and choose units of appropriate size for measurements of very large or very small quantities (e.g., use millimeters per year for seafloor spreading). Interpret scientific notation that has been generated by technology