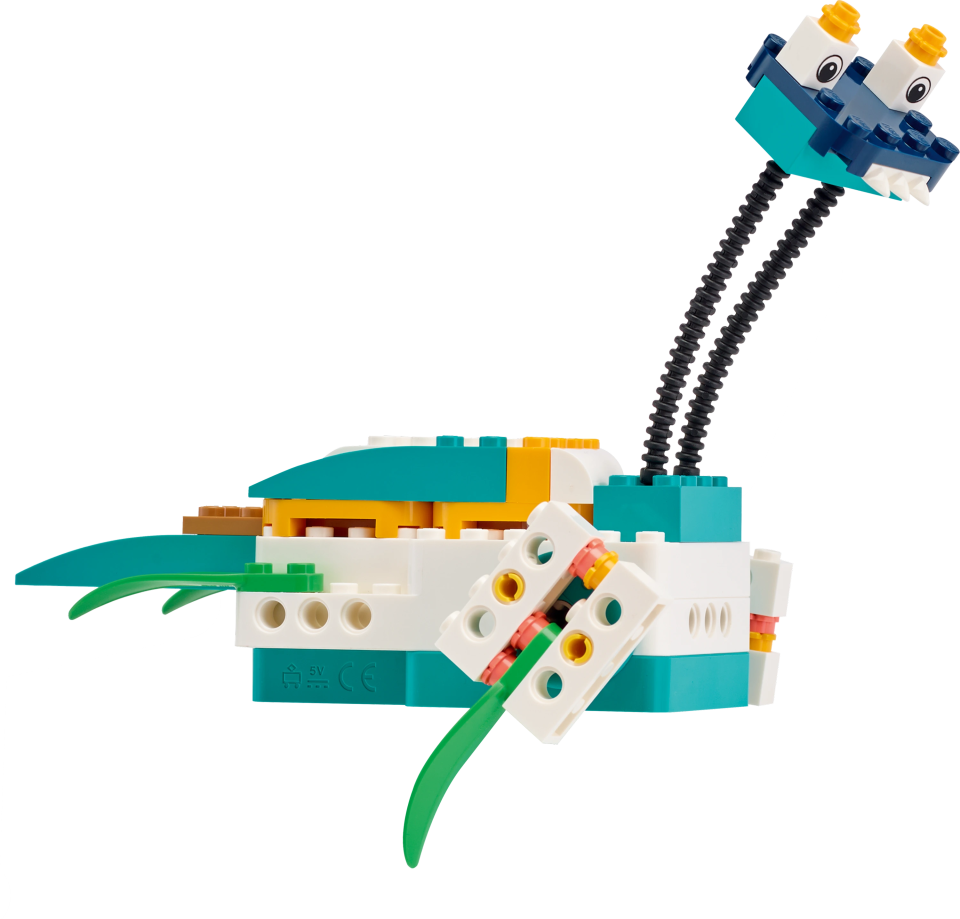
Veggie Love
Use live forecast data to decide whether tomato plants will need to be watered this week.
Lesson Plan
1. Prepare
- Read through the student material in the LEGO® Education SPIKE™ App.
2. Engage (5 Min.)
- Use the ideas in the Ignite a Discussion section below to engage your students in a discussion related to this lesson.
- Explain the lesson.
3. Explore (20 Min.)
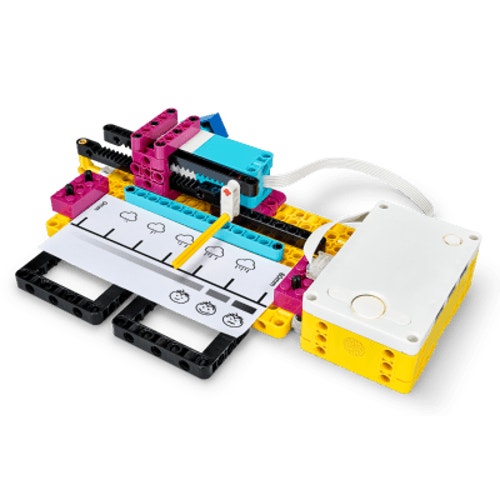
- Have your students work in pairs to build the tomato-meter model.
- Ask them to play the program. Observe their reactions. Remind them that they must enter a city in order for the program to work.
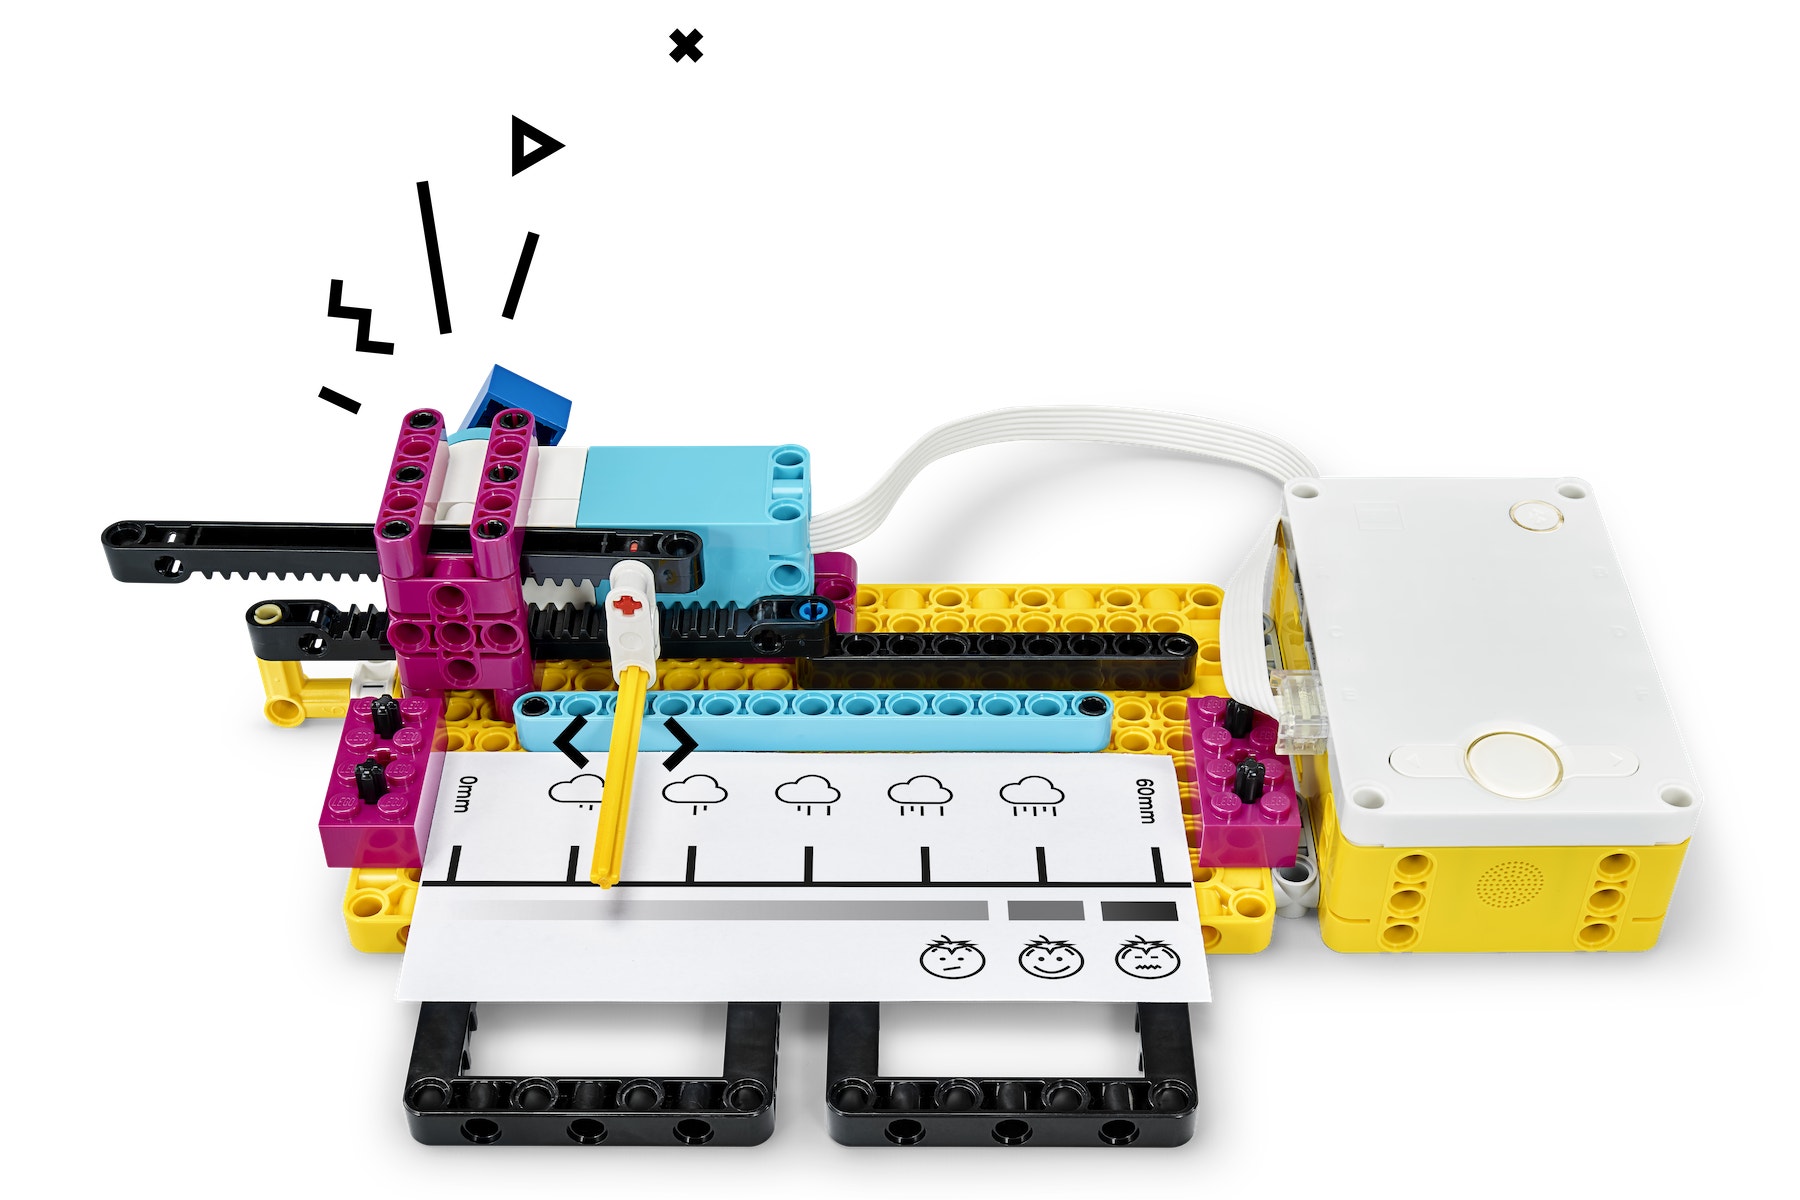
- Let your students figure out how to move the needle in proportion to the amount of precipitation that's forecasted.
4. Explain (5 Min.)
- Have teams pair up with other teams if they need help calibrating their tomato-meter.
5. Elaborate (15 min.)
- Have your students try to display the temperature forecast for the next week. Displaying a value on a scale is a different task than displaying the sum of forecasted precipitation for one week.
- Don't forget to leave some time for cleanup.
6. Evaluate
- Give feedback on each student's performance.
- You can use the assessment rubrics provided to simplify the process.
Ignite a Discussion
Start a discussion about the specifics of how vegetable are grown, their needs and differences. Ask relevant questions, like:
- Can you explain the growth period for any vegetables?
- Why can’t vegetables grow all year long in some regions?
- What's a proportional relation?
Have your students watch this video to see what they're about to do.

Building Tips
Loading the Paper
You can load any type of paper in the tomato-meter. You can use the PDF provided for this lesson or ask your students to create their own.
Coding Tips
Main Program

Possible Solution

Differentiation
Simplify this lesson by:
- Explaining how to figure out how to move the needle according to the amount of precipitation forecasted
Take this lesson to the next level by:
- Letting your students create their own vegetable "water needs" card to place in the tomato-meter
- Using different "water needs" cards among the class or within the same team and validating how quickly they can recalibrate their tomato-meter
Assessment Opportunities
Teacher Observation Checklist
Create a scale that matches your needs, for example:
- Partially accomplished
- Fully accomplished
- Overachieved
Use the following success criteria to evaluate your students' progress:
- Students can calibrate a meter according to the value they're trying to measure.
- Students can make the link between the data manipulation they've made and the relevant real-life situation.
- Students can display a value on their scale (recalibration).
Self-Assessment
Have each student choose the brick that they feel best represents their performance.
- Blue: I can make my tomato-meter move according to the amount of precipitation.
- Yellow: I can correctly display the sum of precipitation forecasted for the next week.
- Violet: I can accurately display temperatures on a scale.
Peer-Assessment
Encourage your students to provide feedback to others by:
- Having one student score the performance of another using the colored brick scale above.
- Asking them to present constructive feedback to each other so that they can improve their group's performance during the next lesson.

Language Arts Extension
To incorporate language arts skills development:
- Have your students meet someone who works in the farming industry and find out if they use similar tools. Ask them to compare this life hack scale with the real instruments farmers use in their fields.
Note: This will make for a longer lesson.
Math Extension
To incorporate math skills development:
- Have your students use the same scale to calibrate different values:
▷ Wind speed over time
▷ Temperature over time - Have them define how the calibration should be made.
Note: This will make for a longer lesson.
Career Links
Students who enjoyed this lesson might be interested in exploring these career pathways:
- Agriculture And Horticulture (Agricultural Mechanics and Technology)
- Agriculture And Horticulture (Food Science)
- Agriculture And Horticulture (Horticultural Science)
- Science, Technology, Engineering & Mathematics (Science and Math)
Teacher Support
Students will:
- Calibrate a scale to display accurate data in a useful and reliable way
CSTA
2-DA-08
Collect data using computational tools and transform the data to make it more useful and reliable.
2-AP-11 6-8
Create clearly named variables that represent different data types and perform operations on their values.