Daytime and Nighttime
Sofie wants to light the path near her campsite for safety. Help her set an overhead lamp to be on at night when it’s dark.

Prepare
(NOTE: This lesson contains a Part A and a Part B. Both are important to access the full learning of the standard. If time is limited, review both parts to choose elements that meet your students’ needs.)
In this lesson, the important learning occurs when graphing the amount of darkness and light in a particular month. Programming a lamp to come on when it’s dark and turn off when it’s light is an opportunity to show that learning in a fun, hands-on way. Encourage students to use the example image(s) for inspiration or to design and build any programmable lamp they wish.
Consider assigning each group a different month to program.
Science Background - Daytime and Nighttime:
- The important variable in this lesson is darkness, not time of day.
- Line or pie charts will be most suitable for the data, enabling students to show 1) the monthly hours of daylight for a year on a line graph or 2) the percentage of light and dark for each month on a series of pie charts.
- Students may use an average daytime/nighttime split for the month (such as data for the 15th of each month) and needn’t show day-to-day changes during the month or times of day.
- Choose and review appropriate types of graphs for your students.
Build Prior Knowledge - Daytime and Nighttime: Using your core science materials, share information, images, and definitions:
- The sun rises and sets at predictable times each day.
- The lengths of daytime and nighttime vary with the month and season.
- Different data are best displayed in particular ways, including line graphs and pie charts.
- Key vocabulary: sunrise, sunset
Building and Programming Experience: Review the suggestions in the Unit Plan. For this lesson, you may also want to
- Reinforce with the Light tutorial in the SPIKE App Start menu.
- Use the Control and Light Blocks sections of the Help>Word Blocks menu in the SPIKE App to provide more support.
- Use the Literary Randomizer lesson to build experience using the light matrix.
Materials: Locate age-appropriate data on local hours of daylight: monthly sunrise/sunset times and average total hours of daylight by month. Search by “average length of day by month” + the name of a nearby city, choosing government agencies and other reliable sources. Supply graphing paper and pencils/markers for drawing graphs. As needed, create templates for line graphs or pie charts and review their use.
PART A (45 Minutes)
Engage
(Whole Class, 5 minutes)
Introduce the story’s main character(s) and the first challenge: Sofie wants to light the path near her campsite for safety. Help her set an overhead lamp to be on at night when it’s dark.
THINK—Facilitate a brief discussion about the lesson topic(s):
- About when was sunrise and sunset yesterday? About how many hours of daylight do we have this month? (Answers will vary. Students should be able to estimate the current number of hours of daylight and approximate sunrise/sunset times.)
- In what seasons is daytime the shortest and longest? (In the northern hemisphere, daytime is shortest in the winter and longest in the summer.)
Distribute a SPIKE™ Essential Set and device to each group.
Explore
(Small Groups, 40 minutes)
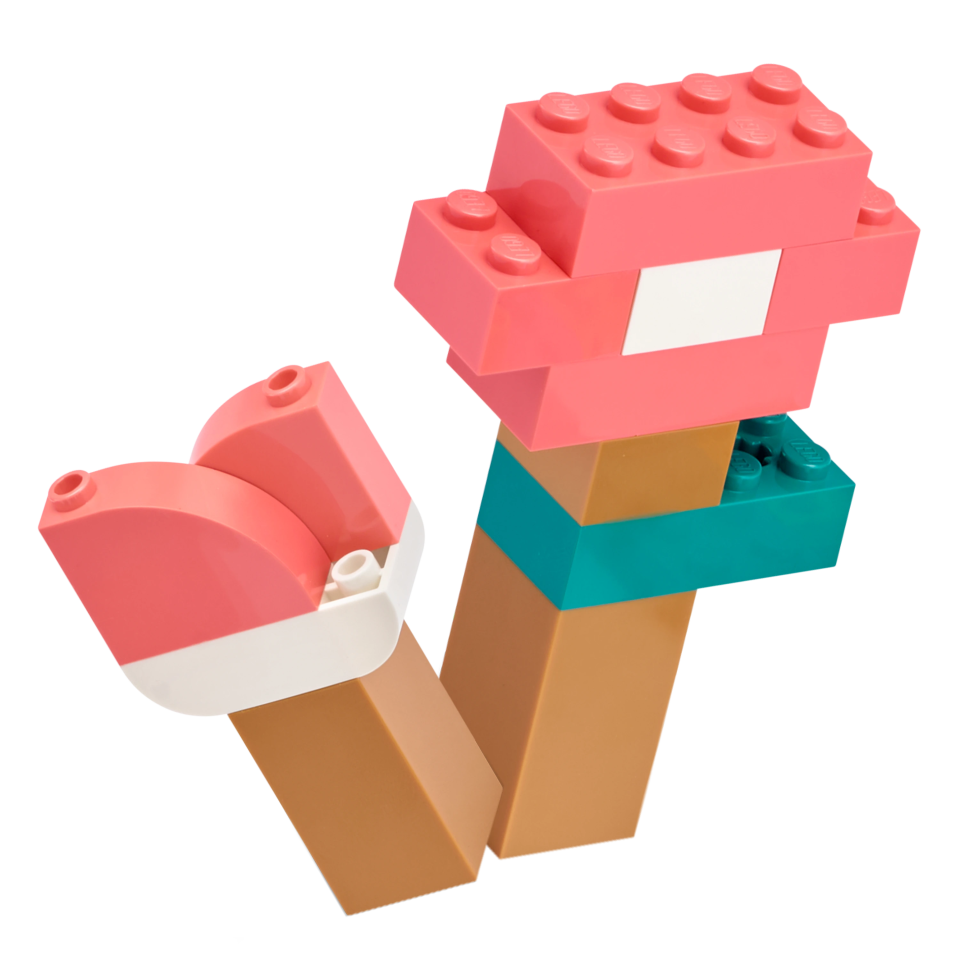
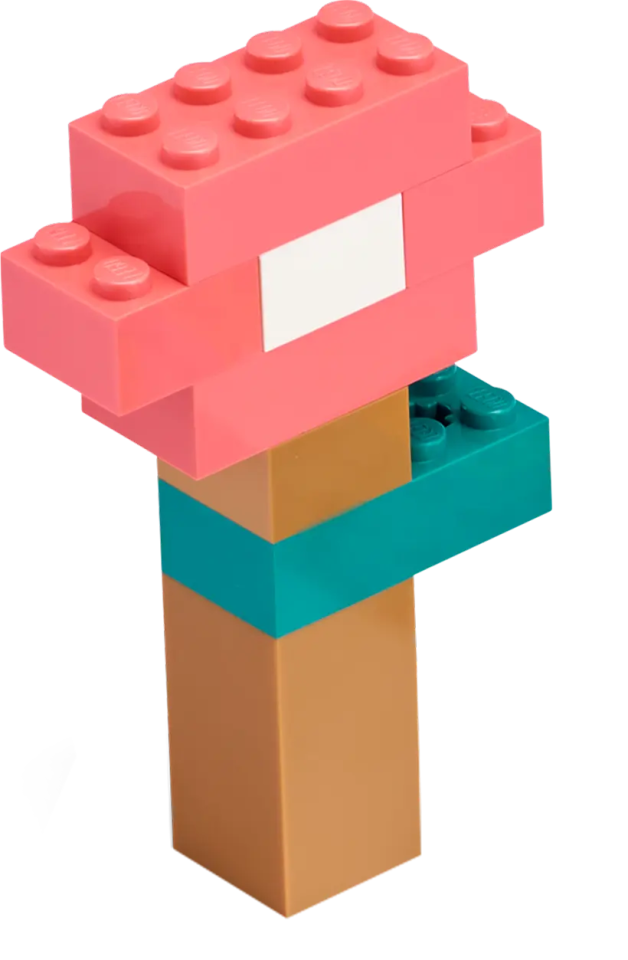
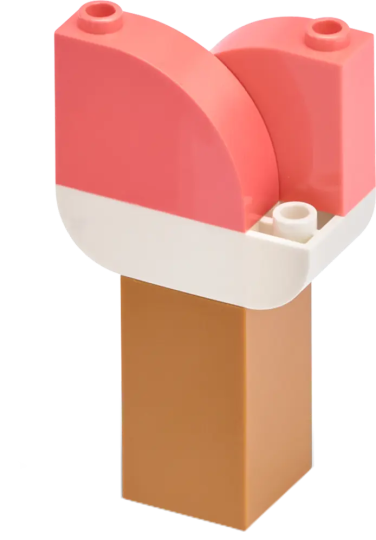
- As students work, consider sharing the examples below as support for building and programming. Clarify that the images show one idea and students should design and build their own programmable lamp.
- Have students:
- Use the base model to BUILD an overhead lamp to illuminate the path in Sofie’s campsite at night when it’s dark and then decide how long it should be on. (They may expand their campsite model later in the lesson.)
- Use the provided data to 1) show the average number of local daytime and/or nighttime hours per month on a line graph or on a series of pie charts and 2) identify the number of hours of nighttime (darkness) in the month you’ve assigned them. See Prepare for more on the data.
- Use the graphed data from their assigned month to PROGRAM their overhead lamp to light the path at night when it’s dark.
- Facilitate brainstorming about ways to program the light, **for example, by representing each hour of nighttime with one second of lamp light. This will enable them to see a “night” without waiting for a real night to elapse. **
- Halfway through work time, have students exchange ideas using a familiar classroom routine, and then update their work with inspiration from sharing.
Example Ideas
Have students keep their models intact for use in Part B. If you prefer, have students Explain after building only, and then program and Explain further during Part B.
.png?locale=en-us&auto=webp&format=jpeg&width=216&height=124&quality=90&fit=bounds)
.png?locale=en-us&auto=webp&format=jpeg&width=216&height=124&quality=90&fit=bounds)

PART B (45 minutes)
Explain
(Whole Class, 20 minutes)
Gather students for sharing.
Have each group use its completed model and graph to demonstrate and explain:
- How they modeled an overhead lamp for a campsite.
- How their graph shows the provided data and what patterns they noticed.
- How many hours of daytime and nighttime (darkness) are in their assigned month.
Elaborate
(Whole Class, 20 minutes)
(15 mins) Have your students iterate and test their models to complete the next challenge in the app: Add a path and trees to expand Sofie’s campsite. Then test the model and program to make sure the lamp illuminates the path at night when it’s dark. Change them to improve how the lamp performs and test again.
If time allows, have students expand their campsite model to include more details (e.g., a tent or plants) or add a color sensor for Sofie to control the light.
(5 mins) Invite students to share knowledge, ideas, or skills that
- Helped them complete the challenge.
- They learned while graphing, building, and programming.
Have students clean up the sets and work areas.
Evaluate
(Whole Class, 5 minutes)
- Ask guiding questions to elicit students’ thinking and their decisions while ideating, building, and programming.
Observation Checklist
Review the learning objectives (Teacher Support box).
Share specific student responses and behaviors at different levels of mastery.
Use the checklist to observe students’ progress:
- They explain how the provided data show monthly patterns in the number of hours of daylight and nighttime (darkness).
- Their graphs present the data accurately and clearly.
- Their models of campsite lamps turn on and off for an appropriate length to represent nighttime (darkness) for their assigned month.
Self-Assessment
Have each student choose the brick that they feel best represents their performance。
- Blue brick: I think I can follow instructions to create a program.
- Yellow brick: I can follow instructions to create a program.
- Green brick: I can follow instructions to create a program, and I can help a friend do it too.
Peer-Feedback
In their small groups, have your students discuss their experiences working together.
Encourage them to use statements like these:
- I liked it when you…
- I’d like to hear more about how you…
Differentiation
Simplify this lesson by:
- Supporting students in using printed or other appropriate graphing templates and tools.
Increase the difficulty by:
- Having students use Broadcast Message and Wait Blocks and When I Receive Message Blocks to write code to control the overhead lamp for multiple months.
- Example code:

Extension
- Have students graph daytime and nighttime data for another city, either one closer to the equator or closer to one of the poles and then compare this new location to the provided local data.
If facilitated, this will extend beyond the 45-minute lesson.
Mathematics: CCSS.MATH.CONTENT.5.MD.A.1
Teacher Support
Students will:
- Use provided data to find monthly patterns in the hours of daylight for a location.
- Present the data in graphical form.
- Create a model of a campsite light that turns on at night and turns off during the day.
(one for every two students)
- LEGO® Education SPIKE™ Essential Set
- Device with the LEGO Education SPIKE App installed
- See Prepare - Materials
Meet the team: Minifigure Bios
- NGSS 5-ESS1-2: Represent data in graphical displays to reveal patterns of daily changes in length and direction of shadows, day and night, and the seasonal appearance of some stars in the night sky.
- CSTA 1B-AP-15
- NGSS 3-5-ETS1-1
- ISTE 1.4.c
- CCSS.ELA-LITERACY.SL.5.1
Mathematics Extension
- CCSS.MATH.CONTENT.5.MD.A.1